

Curious about the latest social media statistics for 2025? Staying updated on these trends is essential for anyone looking to thrive online.
As a social media manager, knowing the current data can help you refine your social media marketing strategy. This article highlights the key social media statistics of 2025, covering user demographics, platform growth, engagement metrics, and much more.
Let’s dive into the data that will shape your social media approach this year!

Social media usage statistics
- In 2025, social media is more popular than ever, with 5.22 billion active users worldwide, making up for more than 60% of the global population.
- With 3.07 billion monthly users and 2.11 billion daily users, Facebook remains the most popular social media platform.
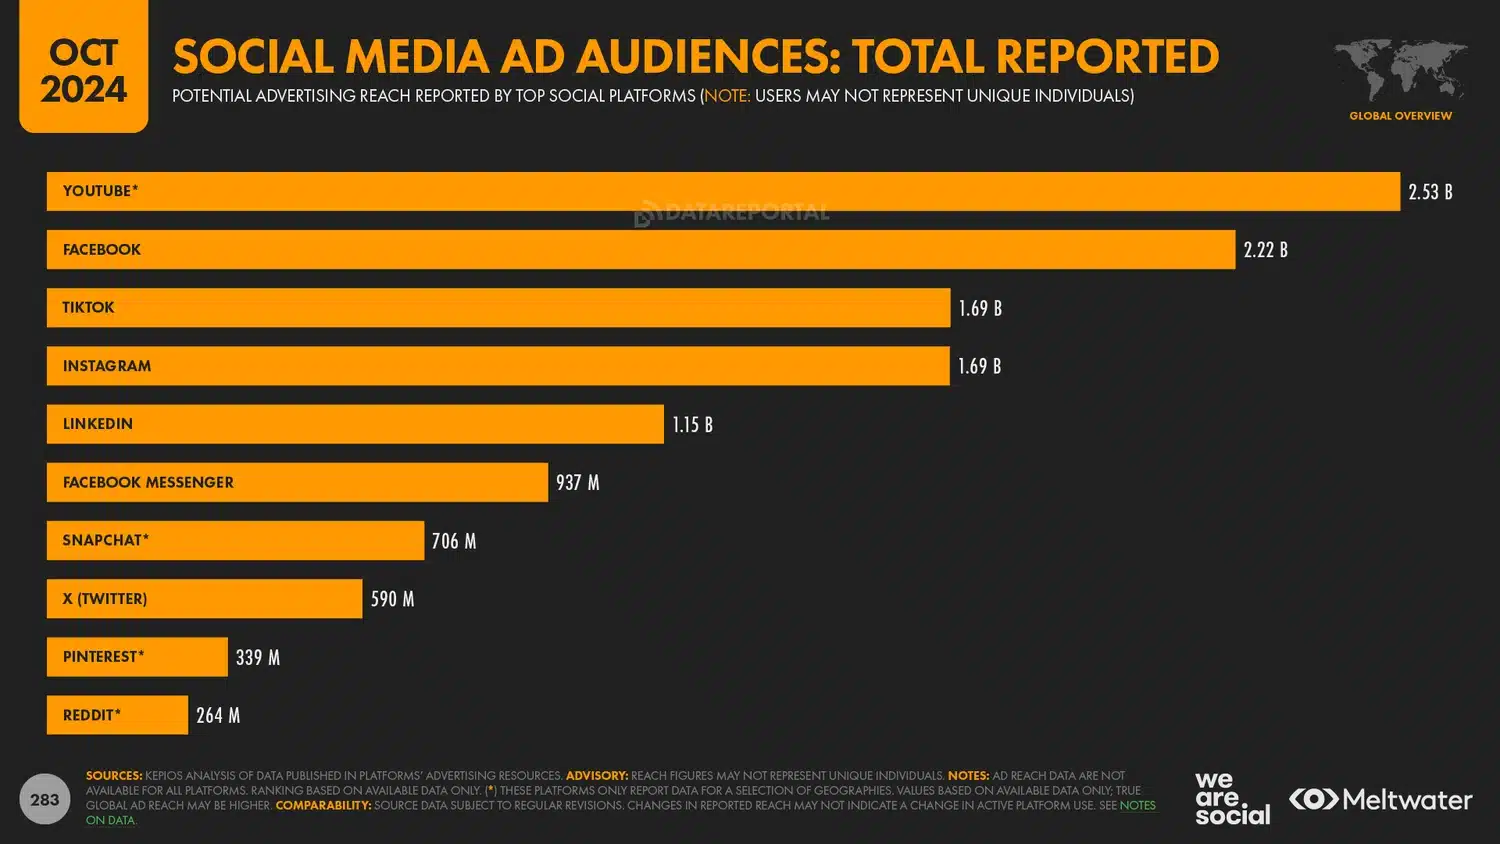
- YouTube isn’t far behind, with around 2.5 billion active users and 122 million daily users.
- According to Data Reportal, the average social media user spends an average of 159 minutes per day online.
- Instagram is a favorite, especially among the 18-34 age group, boasting over 2 billion monthly users. Facebook also sees high engagement from the 25-34 age group, its largest user base.
- People use an average of 6.8 different social networks each month. TikTok is the most popular social platform based on time spent. Global Android users average 31 hours and 32 minutes on TikTok monthly.
- 99% of people worldwide access social media on a mobile device (tablet or phone).
- In the US, 54% of social media users are female. 46% of social media users are male. The global average is 46.4% female and 53.6% male.
- 72.5% of the total US population actively use social media. This totals 246 million people in the US.
- Social media users worldwide grew from 4.72 billion in January 2023 to 5.04 billion in January 2024, an 8% increase. This growth reflects the addition of 320 million new users in just one year, underscoring the rapid expansion of social media globally.
Social media marketing & advertising statistics
- Facebook and Instagram lead the pack with each platform accounting for 29% of marketers’ highest ROI, while YouTube and TikTok also play significant roles with 26% and 24% respectively.
- Ad spending in the Social Media Advertising market is projected to reach $276.7 billion in 2025.
- 46.1% of global survey respondents from GWI indicated using social media for brand research.
- Digital video ad spending reached $191.4 billion in 2024 and is projected to reach $207.5 billion in 2025.
- Social media ads are the top source of new brand discovery for internet users aged 16-24.
- Social media is recognized as the leading marketing channel. The majority of industry specialists incorporate it into their digital campaigns.
- Benefits of social media marketing include boosted exposure, increased traffic, lead generation, and direct communication between brands and consumers.
- The average global online shopping order value from social media platforms reached $87.5 billion in mid-2023, though it was lower compared to values from search or email sources.
Social media video statistics
- Currently, 89% of businesses use videos as a key marketing tool. On average, people spend 17 hours per week watching videos online, and 60% prefer online videos over television.
- YouTube remains a powerhouse video social media site with over 1 billion hours of videos viewed daily.
- Mobile device usage accounts for 70% of YouTube video consumption.
- TikTok also shows significant engagement, as US adults spend an average of 56 minutes daily watching TikTok videos. Funnily enough, more than half of adult TikTok active users have never posted a video of their own.
- During a global survey of social media marketers in 2023, 56% stated they would increase their video activities on Instagram in the next 12 months. while 59% planned to do so on YouTube.
- Testimonial and explainer videos are the most used in global marketing.
- YouTube is the leading platform for video marketing, with 90% of marketers utilizing it
- Instagram and TikTok are also crucial platforms for video marketing. TikTok is expected to account for nearly 40% of global video ad revenue by 2027.
Influencer marketing statistics
- The global influencer marketing industry reached $21.1 billion by 2024, up from $16.4 billion in 2022. It is projected to reach $47.8 billion by 2027.
- Influencer marketing delivers a high ROI, with businesses earning an average of $5.78 for every dollar spent on influencer marketing.
- Instagram remains the most popular social media platform for influencer marketing, with 72% of brands utilizing it for their campaigns. TikTok is quickly catching up, with 61% of brands planning to increase their spending on the platform due to its high engagement rates.
- About 69% of consumers trust influencer recommendations more than traditional advertising.
- One might assume that big names drive the most engagement, but 91% of all engagement actually comes from micro-influencers, marking a 2% increase since 2020.
Gen Z social media statistics
- Gen Z, born between 1997 and 2012, represented about 25% of social media users worldwide in 2024. They are highly active, with 35% spending over four hours daily on social media.
- YouTube, Instagram, and TikTok see high engagement from Gen Z users.
- Facebook’s popularity was declining among Gen Z users. Only four in 10 surveyed reported engaging with the Meta-powered platform.
- There are notable gender differences in platform preferences among Gen Z users in the US. Pinterest has a 57% use rate from females, compared to only 15% from men. Instagram is favored by 83% of girls. TikTok sees higher engagement from female users (76%) compared to boys (60%).
- Gen Z consumers are discerning about online advertising. Around one-third find online ads and those based on search history annoying.
Facebook statistics you need to know
Facebook remains a dominant force in social media, shaping how we connect and engage online.
To make the most of your social media strategy, here are the essential Facebook statistics you need to know:
1. Facebook user demographics
- As of 2025, Facebook’s user base is roughly evenly split, with female users making up 43.2% and male users comprising 56.8%.
- Younger people are increasingly favoring other platforms, but Facebook remains popular among older age groups.
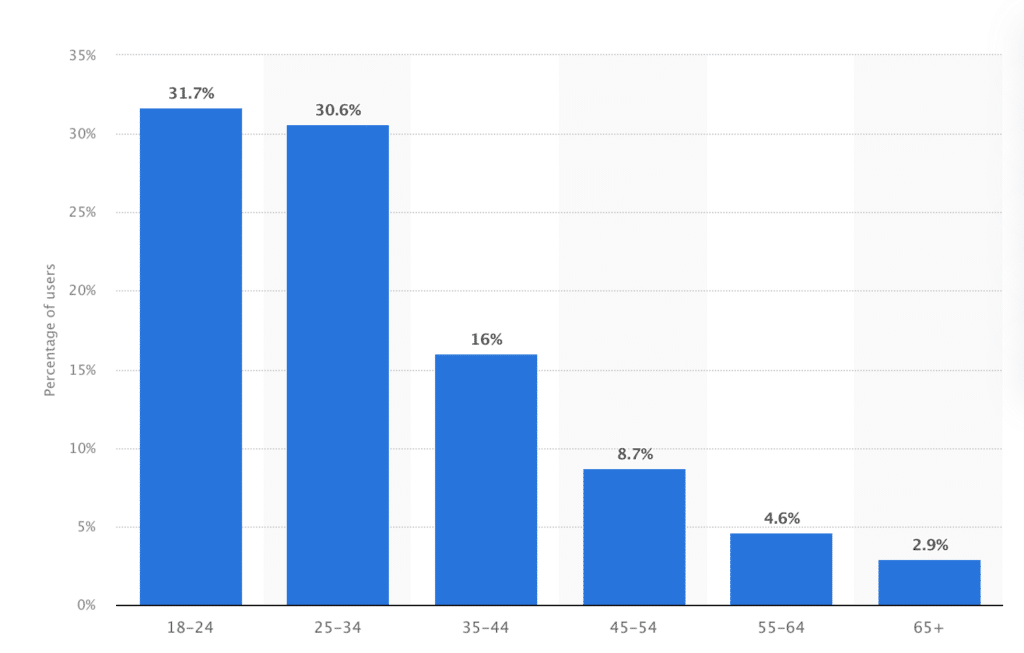
- The largest age demographic on Facebook is users aged 25-34, accounting for 24.2% of the US user base.
- Nearly 20% of Facebook’s worldwide users are men aged 25-34, making this group one of the platform’s largest demographics. Female users aged 13-17 represent the smallest demographic on Facebook globally.
- India has the largest Facebook audience, boasting 314.6 million users. The United States follows with 175 million users, highlighting Facebook’s significant global presence.
2. Facebook usage statistics
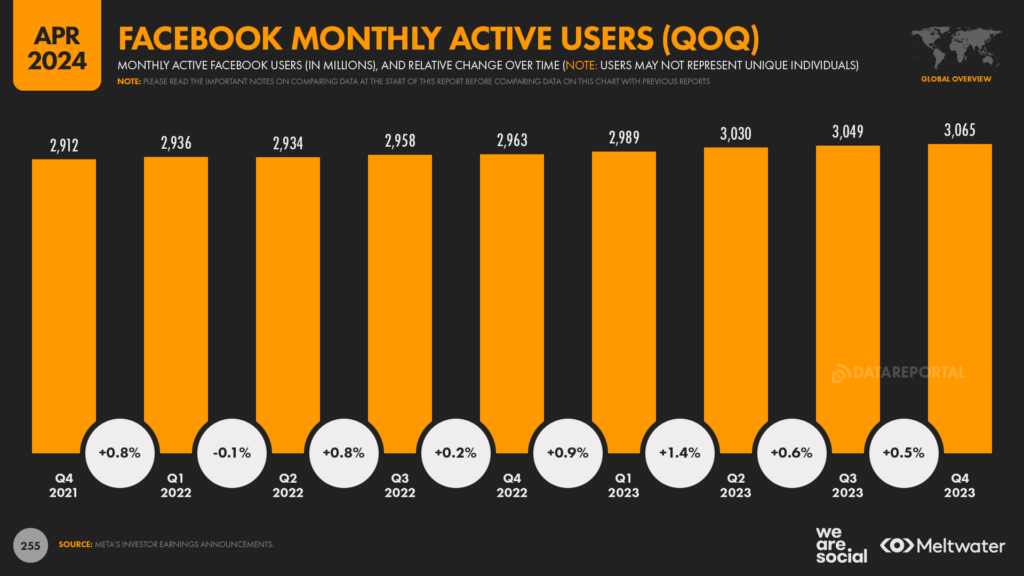
- Facebook has 3.07 billion monthly active users as of October 2024, making it the most used social media platform.
- As of Q4 2023, Facebook reached 2.11 billion daily active users, marking a 5.5% increase year-over-year. 39.8% of the world’s population uses Facebook every month, showcasing its extensive global reach.
- Facebook is the world’s most downloaded social media app worldwide emphasizing the platform’s dominance on mobile devices.
- In 2023, their messaging platform, Facebook Messenger, generated approximately 262.5 million downloads, a decrease of 20% compared to 2022.
- The average U.S. adult spends 33 minutes a day on Facebook, and users globally spend about 19.7 hours a month on the platform. The typical social media user spends approximately 35 minutes daily on Facebook.
3. Facebook engagement statistics
- The average engagement rate for a Facebook page post is 0.06%.
- Over 1 billion Stories are posted daily across Facebook apps, indicating the popularity of this feature.
- Facebook generates 500K likes every minute, demonstrating a high level of user activity.
- 90% of Facebook users post native videos, and video posts increase interaction by 600% compared to other types of posts.
4. Facebook business statistics
- Over 200 million small businesses use Facebook Pages to connect with customers.
- There are over 250 million Facebook Shops worldwide, allowing businesses to sell products directly through the platform.
- More than 65% of Facebook users visit local business pages at least once a week.
- 19% of US consumers begin their shopping search on Facebook.
5. Facebook advertising statistics
- Marketers can reach a potential audience of 2.249 billion users through Facebook ads.
- Facebook hosts over 10 million active advertisers as of 2024.
- The average cost per click for Facebook ads was $0.69 as of March 2024
- In 2022, Facebook generated more than $113 billion in advertising revenue, projected to grow to $127 billion by 2027.
- Facebook video ads have an impressive 8% click-through rate, higher than other platforms.
Instagram statistics you need to know
Instagram is one of the leading social media platforms, known for its high engagement and diverse user base.
Here are the statistics you need to know about Instagram consumer behavior:
1. Instagram user demographics
- Instagram’s user demographics are varied, reflecting its broad appeal. As of 2025, Instagram has over 2 billion monthly active users, making it one of the most popular social media platforms globally.
- The platform sees a fairly even split between male and female users, with 50.6% male and 49.4% female.
- India has the largest Instagram audience, with over 362.9 million users, followed by the United States with 169.65 million users.
- The largest age group on Instagram is users aged 18-34, who make up about 62.3% of the user base, showing a strong appeal to younger people.
2. Instagram usage statistics
- Instagram usage remains significant, with users highly engaged on the platform. On average, users spend about 33.9 minutes per day on Instagram, reflecting its major role in daily social media activity.
- The platform is particularly popular for visual content, with 500 million daily active users engaging with Instagram Stories.
- Monthly, users spend an average of 12 hours on Instagram, indicating strong user retention and interaction.
- Additionally, 90% of users follow at least one business account, showcasing the platform’s importance for brand engagement.
- Instagram is also the 5th most visited website globally, highlighting its widespread popularity.
3. Instagram engagement statistics
- Engagement on Instagram is notably high, driven by its visual and interactive content. Posts on Instagram have an average engagement rate of 1.89%.
- Instagram Reels, introduced as a competitor to TikTok, have seen tremendous success, generating twice the reach of other Instagram post types.
- Each day, Instagram users like 4.2 billion posts, comment 95 million times, and share millions of Stories.
4. Instagram business statistics
- Businesses heavily utilize Instagram for marketing and customer engagement. There are approximately 200 million business profiles on Instagram, and 90% of users follow at least one of them.
- Approximately 60% of users discover new products on Instagram, underlining its importance for brand discovery.
- Additionally, 87% of users take action, such as visiting a website or making a purchase, after viewing a brand’s post.
- Instagram’s shopping features, including Instagram Shops, have also seen widespread adoption, facilitating direct purchases from the app.
5. Instagram advertising statistics
- The platform’s ad reach is over 1.628 billion users, providing advertisers with a vast audience.
- Instagram is set to make more than half of Meta’s ads revenue in 2025.
- More than 80% of marketers advertise their products on Instagram.
- Ads on Instagram’s feed have an average click-through rate of 0.22%, while ads in Stories have a higher CTR at 0.33%.
- Video ads, including Story ads, drive higher engagement, with video content seeing a 38% higher engagement rate than image posts.
X (Twitter) statistics you need to know
X, formerly known as Twitter, is still a significant player in the social media landscape in 2025. With a diverse user base and extensive global reach, X remains a critical platform for individuals, businesses, and advertisers.
Here are the most important X statistics you need to know:
1. X (Twitter) user demographics
- As of 2025, X has over 600 million monthly users with distinct demographic characteristics.
- The platform’s users are predominantly male, making up 68.7% of the user base, while female users account for 31.3% of its audience.
- The largest age group on X is users aged 25-34, representing 29.95% of its demographic, highlighting the platform’s appeal to young adults.
- X’s global reach is significant, with high user numbers in the United States, Japan, and India, indicating its widespread international appeal.
- Additionally, the platform has been noted for its varied user interests, ranging from news consumption to entertainment and business updates.
2. X (Twitter) usage statistics
- Users spend an average of 30.9 minutes per day on X.
- A quarter of X’s traffic comes from the United States.
3. X (Twitter) engagement statistics
- Engagement on X is driven significantly by multimedia content. Tweets that include videos attract ten times more engagement than those without, underscoring the importance of visual content in user interactions.
- Each day, users watch approximately 8 billion videos on X, highlighting the platform’s capacity to captivate its audience through video content.
4. X (Twitter) business statistics
- X is a great tool for businesses looking to engage with their audience. Business accounts on X have reported high levels of user engagement, with 54% of users likely to purchase new products from brands they follow on the platform.
- In 2023, X experienced a 5% decrease in average CPM and a 27% decrease in average cost-per-conversion.
5. X (Twitter) advertising statistics
- Advertising on X offers significant reach and engagement opportunities. The median engagement rate is 0.59%.
- Promoted Tweets with video content are 10 times more engaging and 50% cheaper in terms of cost-per-engagement.
- X ad revenue is declining, with estimates showing a 5.1% drop in 2024, and a predicted 4.8% drop in 2025 to $2.99 billion.
YouTube statistics you need to know
As the second largest search engine, YouTube continues to dominate as a leading platform for video content, with extensive reach and engagement.
Here’s what YouTube statistics you need to know:
1. YouTube user demographics
- YouTube’s user base is vast and diverse, reflecting its global reach. As of January 2025, YouTube boasts nearly 2.7 billion monthly active users, making it one of the largest social media platforms globally.
- The gender distribution is relatively balanced, with 54.4% male users and 45.6% female users.
- As of 2023, YouTube was the most popular social media site among Gen Z users with 96% of respondents in this age group reporting using this video platform. 86% have a favorable opinion about YouTube as a brand.
- The largest age group on YouTube is users aged 25-34, who account for 21.5% of its demographic, followed closely by the 35-44 age group at 17.9%.
- India leads with the largest number of active users, followed by the United States and Brazil.
2. YouTube usage statistics
- YouTube remains a powerhouse in online video consumption. On average, users spend about 40 minutes per session on YouTube, indicating deep engagement.
- The platform sees over 1 billion hours of video watched daily, highlighting its role as a leading source of video content.
- YouTube Shorts, a feature introduced to compete with TikTok, sees 70 billion daily views, showing rapid adoption and user interest.
3. YouTube engagement statistics
Engagement on YouTube is driven by its extensive video library and user interaction features.
The average engagement rate on YouTube was 3.87% in 2024, higher than many other platforms. Videos on YouTube see significant interaction, with users liking, commenting, and sharing content regularly.
4. YouTube business statistics
- Over 3 million US content creators and channels are active on YouTube, with many using the platform to drive business goals.
- Approximately 62% of businesses use YouTube to post video content, highlighting its importance in digital marketing strategies.
- YouTube helps about 90% of users discover new brands or products, emphasizing its role in brand discovery and customer acquisition.
- Additionally, YouTube’s shopping features, such as product links in videos, facilitate direct purchases from the platform, with over 40% of users making purchases after seeing a product on YouTube.
5. YouTube advertising statistics
Advertising on YouTube offers substantial reach and engagement opportunities. YouTube’s ad reach extends to over 2.5 billion users, providing advertisers with a vast audience of almost 31.5% of world’s population.
Advertisers benefit from precise targeting options, enabling them to reach specific demographics effectively.
LinkedIn statistics you need to know
LinkedIn continues to be the go-to platform for professional networking and business engagement.
Here are some interesting LinkedIn statistics for 2025:
1. LinkedIn user demographics
- In 2025, LinkedIn has over 1 billion members worldwide, reflecting its significant reach among professionals.
- The platform’s gender distribution shows a slight male majority, with 57% male users and 43% female users.
- The largest age group on LinkedIn is users aged 25-34, accounting for about 50% of the user base, followed by users aged 35-54, who make up approximately 21%.
- The United States leads with the highest number of LinkedIn users, followed by India and China.
- LinkedIn’s appeal is particularly strong among professionals and businesses, making it a key platform for career development and industry networking.
2. LinkedIn usage statistics
- LinkedIn usage is focused on users highly engaged in professional content and networking. On average, LinkedIn sees over 310 million monthly active users, with significant daily interaction.
- Users spend an average of 17 minutes per session on LinkedIn.
- Mobile devices account for 57% of LinkedIn traffic, so it’s super important to focus on mobile-friendly content.
3. LinkedIn engagement statistics
- The average engagement rate on LinkedIn posts is 4.8%, higher than many other professional platforms.
- LinkedIn reports that it sees 2 new members join every second.
- 40% of monthly active users visit LinkedIn daily.
- LinkedIn posts with images receive 98% more comments than those without.
- Videos get shared 20 times more than any other content format on LinkedIn.
- LinkedIn Live streams increased by 89% year-over-year.