If you want to grow your audience on X (Twitter), understanding your analytics is a must. Metrics like impressions, engagement, and follower growth show you what’s working and where you can improve.
While X Premium gives you access to these insights, tools like SocialBee offer even more flexibility, helping you track performance, optimize your posting schedule, and plan content ahead of time.
In this guide, we’ll explain how to access X analytics and highlight the key metrics you should focus on in order to boost your social media presence. Let’s get started!
We’re SocialBee LABS SRL, part of WebPros. We use the information you provide to share relevant content and product updates, as outlined in our Privacy Policy. You can opt out anytime.
Short Summary
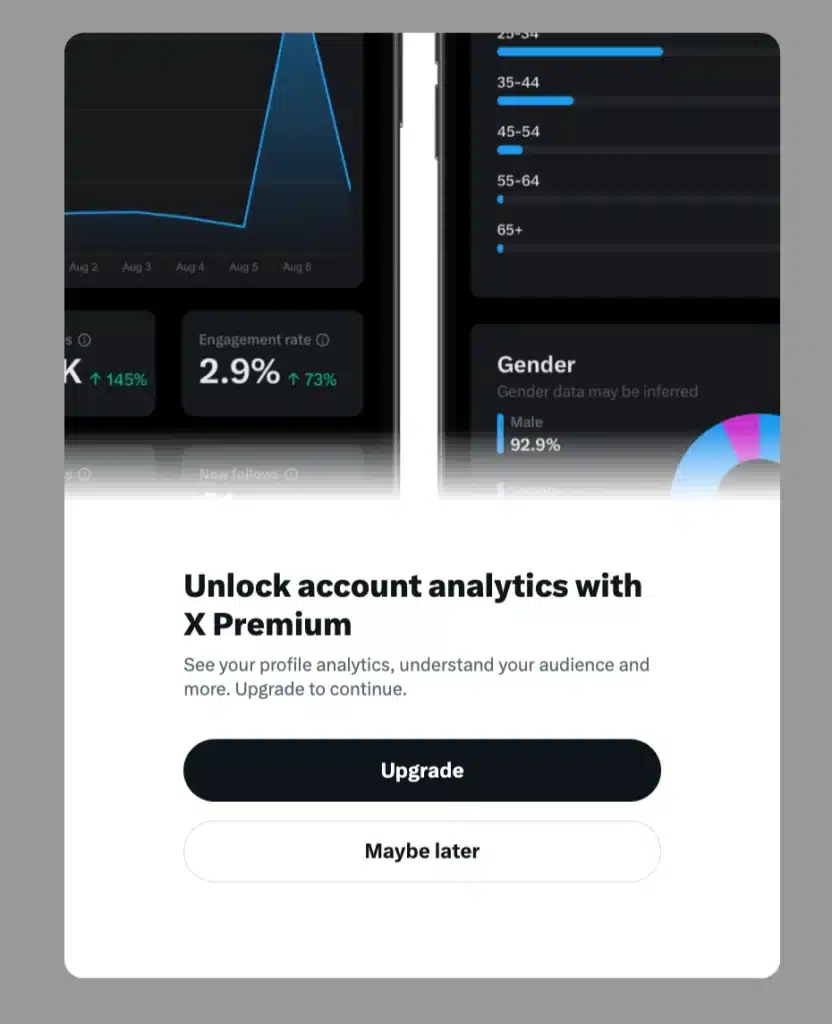
- You’ll need an X Premium subscription to access detailed analytics, including metrics like impressions, engagement, and follower growth.
- On mobile, you can only view basic stats for individual posts by tapping “View Analytics” under a tweet.
- On desktop, the full analytics dashboard is available at analytics.twitter.com, showing metrics like impressions, engagement, and ad performance. Desktop also lets you explore trends and track your overall account performance.
- Impressions show how many people saw your tweet, while engagement rates measure how interactive your audience is. Other useful metrics include profile visits, follower growth, and link clicks.
- Tools like SocialBee let you track your content performance and manage your posts across platforms, keeping you in control of your social media presence.
What is X (Twitter) analytics?
X (Twitter) Analytics is a feature available only for X Premium users, offering data on how your posts perform.
It shows metrics like impressions, engagement rates, and profile visits, so you can track how your audience interacts with your content. For videos, you get details like views and watch time to see what resonates.
How to access Twitter analytics
There are three ways to access your Twitter analytics:
- Via mobile
- Via desktop
1. How to access your Twitter analytics via mobile
The X/Twitter mobile app doesn’t include the full analytics dashboard, but you can still access metrics for individual posts.
Follow these steps to access X analytics on mobile:
- Open the X/Twitter app on your mobile device.
- Navigate to a specific post.
- Tap View Analytics located below the tweet.
Here’s what you can see for each post:
- Likes, retweets, and comments: Basic engagement metrics.
- Tweet impressions: The number of times your tweet was viewed.
- Engagements: Total interactions, including clicks and shares.
- New followers: Track the number of Twitter followers gained from this specific post.
- Detail expands: See how many Twitter users clicked to read the full tweet (for longer posts).
- Profile visits: Monitor how many people visited your profile after viewing the tweet.
2. How to access your Twitter analytics via desktop
Using your desktop browser, you can view the full native Twitter analytics dashboard, which provides an in-depth overview of your account’s performance.
Here’s how to access Twitter insights from your desktop:
- Go directly to https://analytics.twitter.com and log in with your X/Twitter account credentials.
OR - From your main Twitter dashboard, click on the three dots on the left-hand menu.
- Select Creator Studio and then Analytics from the dropdown menu.
Once on the dashboard, you can explore detailed Twitter analytics data, including:
- Tweet activity: Click on the Tweets tab to see a monthly overview of your post performance.
- Impressions: Discover how many people viewed your tweets.
- Engagements: Monitor interactions, including likes, retweets, and clicks.
- Twitter campaign details: Check the performance of the ads you have shared on your X account.
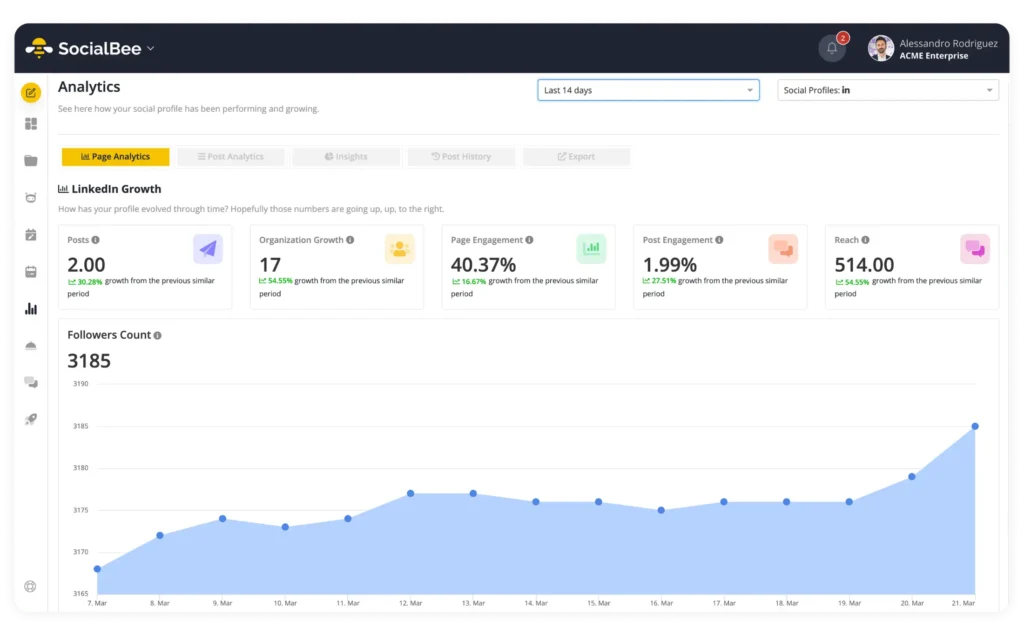
Want to improve your Twitter (X) strategy? SocialBee makes it easy to track what’s working and adjust your approach. You’ll see the best times to post, which types of content are performing the best, and how your audience is growing, all in one place.
The dashboard breaks down post performance by categories, a SocialBee way of organizing content, so you can see whether links, images, or text posts are getting the best results. You can also track follower growth and reach over time. It’s a simple way to fine-tune your content and get better results.
Track your Twitter analytics with SocialBee.
Most important X (Twitter) analytics metrics to check
When analyzing your X (formerly Twitter) performance, there are some various metrics to focus on:
- Impressions
- Engagement
- Engagement rate
- Profile visits
- Follower growth
- Link clicks
- Video views
1. Impressions
How many impressions a post has shows how many times your tweet has appeared on someone’s feed. This metric helps gauge the visibility of your content, but it’s not the full story.
For example, this post from The Economist has been viewed 24K times:
A high number of impressions indicates good reach, but pairing it with engagement metrics will give you a better idea of how effective your tweets are at driving interaction.
2. Engagement
Engagement track actions taken on your tweet, including likes, retweets, replies, and link clicks.
This metric gives insight into how your audience is responding to your content. High engagement means your tweets are resonating, and it can guide you in creating posts that encourage more interaction.
3. Engagement rate
Engagement rate calculates the percentage of engagements compared to impressions. This metric is useful for understanding how well your content performs relative to its reach.
A good engagement rate typically falls between 0.5% to 2%, depending on your industry and audience. A high engagement rate means your audience finds your content relevant and compelling.
4. Profile visits
Profile visits indicate how many people checked out your profile after seeing one of your tweets.
A spike in this metric suggests that your content is interesting enough to make users want to learn more about you or your brand, making it a sign of effective messaging.
5. Follower growth
Follower growth shows how your audience size changes over time. A steady increase in followers is a good sign that your content is attracting and retaining viewers.
Conversely, a decline in followers could mean it’s time to reassess your strategy or adjust your tone.
6. Link clicks
If you include links in your tweets, link clicks measure how many users clicked on them. This is especially important for businesses or marketers looking to drive traffic to blogs, product pages, or other external content. It reflects the effectiveness of your tweets at encouraging action.
7. Video views
If you share videos, video views reveal how many times your content was played. This metric is particularly useful for understanding the reach and effectiveness of video-based campaigns. Pair this with watch time to see how long users are staying engaged.
8. Reach
Reach measures how many unique users have seen your content. Unlike impressions, which count each time a tweet appears, reach tracks the number of distinct accounts that have viewed your tweet. This metric helps you understand how far your content is spreading across Twitter (X).
A higher reach means your content is reaching a broader audience, beyond just your followers. To improve reach, consider using relevant hashtags, engaging with users, and posting during peak times.
Frequently asked questions
You can’t access your Twitter analytics anymore without a premium account.
To see your Twitter impressions, you’ll need to subscribe to X Pro (formerly Twitter Blue), which includes access to detailed analytics like impressions and engagement for your tweets. Once subscribed, go to analytics.x.com and check your Twitter data.
Alternatively, you can use tools like SocialBee to track impressions and engagement while managing your tweets in one place.
The best tools for X (Twitter) analytics are X Pro and SocialBee. X Pro gives you access to detailed analytics like impressions, engagement, and follower growth directly on the social network.
For more flexibility, SocialBee not only tracks performance but also helps you schedule and manage your posts across platforms. Both tools are great options to keep your Twitter strategy on track.
Ready to start analyzing your X (Twitter) account?
Tracking X (Twitter) analytics is more than just numbers. It’s about understanding your audience, refining your content strategy, and making sure your efforts pay off.
While X Premium gives you access to analytics directly within the platform, tools like SocialBee offer a more flexible dashboard that allows you to monitor your performance across multiple social media channels.
Whether you’re a business, a marketer, or a content creator, SocialBee provides the tools you need to simplify your work and adjust your strategy based on real data.
Ready to try it? Start your 14-day free trial with SocialBee today! No credit card required.
