
What would your social media strategy look like if it were based on millions of real posts instead of opinions?
We analyzed 9,332,840 posts published across 10 social networks, along with growth and engagement data from tens of thousands of active SocialBee users throughout 2025.
This report highlights the latest social media trends that show up in real publishing behavior, not just hot takes.
I’ll break down where brands are actually posting, when they publish, what formats drive engagement, and which platforms are still delivering growth, so you can plan your 2026 digital marketing strategy based on evidence, not guesswork.
Methodology
This research is based on aggregated, anonymized usage data from SocialBee collected throughout 2025. It analyzes how people actually use social media management tools in their day-to-day work.
We examined 9,332,840 posts published across 10 major social networks.
To understand account management, growth, and engagement trends, we also analyzed social media data from tens of thousands of users who connected multiple social media accounts to the platform.
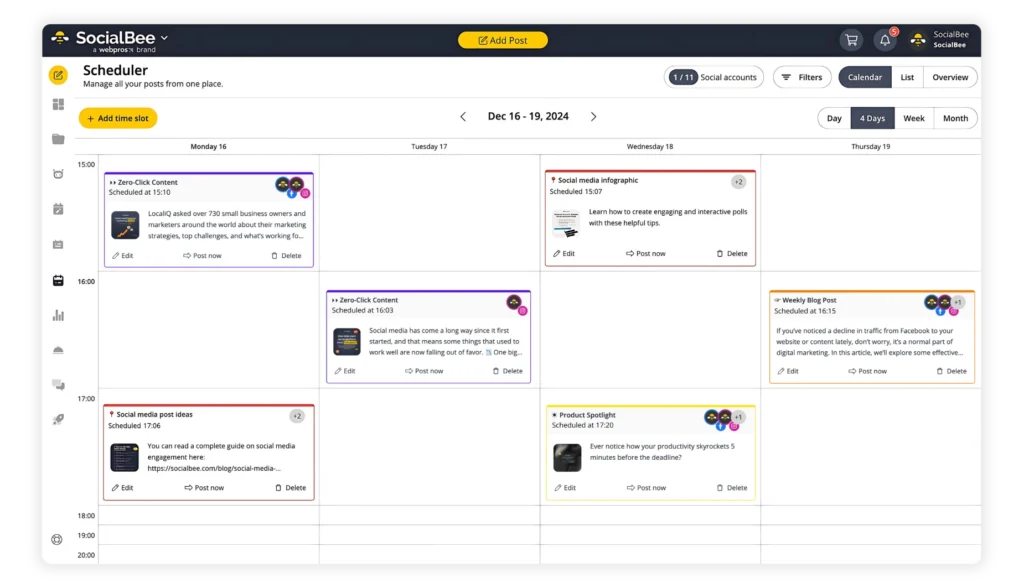
Which social media platforms do brands post on the most?
Based on the analysis of 9,332,840 posts published across 10 social networks, brands post on Facebook more than anywhere else. In 2025, 44.5% of all social media posts were published on Facebook, making it the clear leader by publishing volume.
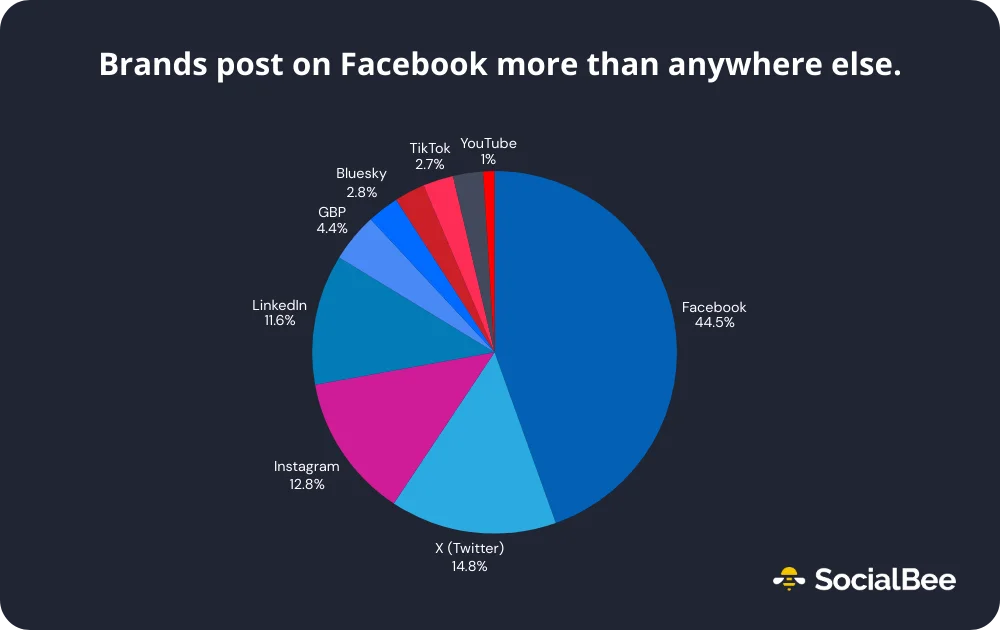
To put that into perspective, nearly one out of every two social media posts goes to Facebook. X (Twitter), Instagram, and LinkedIn follow, but each sits far behind Facebook on its own. X accounts for 14.8% of posts, Instagram 12.8%, and LinkedIn 11.6%.
Here’s the full list of social media platforms users post the most on:
- Facebook: Of the 9,332,840 social media posts analyzed from 2025, the vast majority, 4,157,751, were published on Facebook, representing 44.5% of total posting activity.
- X (Twitter): 1,378,509 posts were shared on X in 2025, accounting for 14.8% of all posts in the dataset.
- Instagram: Instagram received 1,197,383 posts, making up 12.8% of the 9.3 million posts analyzed.
- LinkedIn: With 1,083,542 posts published, LinkedIn captured 11.6% of total publishing volume.
- Google Business Profile: 406,695 posts were published to Google Business Profiles in 2025, representing 4.4% of all analyzed posts.
- Bluesky: 262,443 posts were published on Bluesky, accounting for 2.8% of total social media publishing.
- Pinterest: Posting activity on Pinterest totaled 253,354 posts, or 2.7% of the overall dataset.
- TikTok: 250,982 posts were published on TikTok, placing it at 2.7% of total publishing volume.
- Threads: With 249,141 posts published, Threads matched TikTok and Pinterest at 2.7% of total posts.
- YouTube: 93,040 uploads were published on YouTube, accounting for just 1.0% of all posts analyzed.
Conclusions
What this data tells us is that social media usage and publishing is still very concentrated. Facebook, X, Instagram, and LinkedIn make up more than 80% of all posts, even though newer platforms get a lot of attention.
For most teams, platform choice is less about hype and more about audience behavior and where a huge part of their target audience actually engages consistently.
Lower posting volume on platforms like TikTok, YouTube, and Pinterest doesn’t mean they’re less valuable. In most cases, it just means the content takes more time to plan, create, and approve.
When time is limited, consistency tends to win over experimentation. Most teams would rather stay visible on a few core platforms than spread themselves thin trying to be everywhere.
Which days do users post on social media the most?
Based on the 9,360,007 posts analyzed, most social media content is published during the middle of the week, with Wednesday clearly leading. In practice, this means nearly half of all posts go out between Tuesday and Thursday.
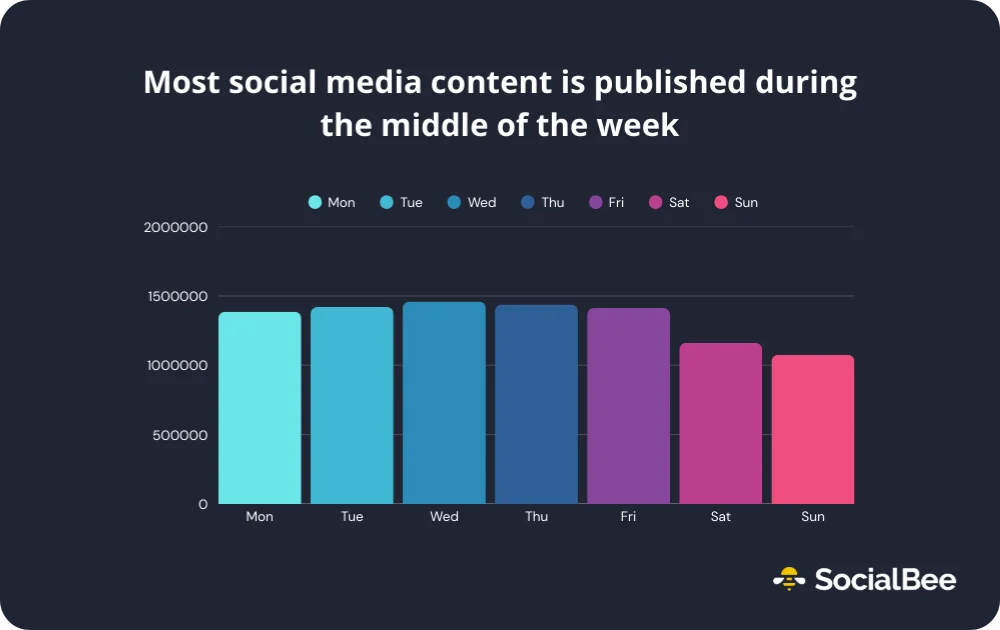
Wednesday alone accounts for 15.6% of all posts, or 1,458,879 pieces of content. Thursday and Tuesday are right behind, each hovering around 15%. When you put those three days together, 46.1% of all social media posts are published midweek, making it the most crowded part of the schedule.
On the other hand, Sunday is the least popular day to publish, with 1.08 million posts, or 11.5% of total posting activity. Saturday and Sunday combined account for just 23.9% of all social media posts, less than one quarter of total volume.
Here’s how posting volume breaks down by day of the week:
- Wednesday: 1,458,879 posts, accounting for 15.6% of all social media posts.
- Thursday: 1,437,514 posts, representing 15.37% of total posting volume.
- Tuesday: 1,419,647 posts, making up 15.18% of all posts.
- Friday: 1,412,790 posts, or 15.11% of total activity.
- Monday: 1,385,700 posts, accounting for 14.82% of posts.
- Saturday: 1,160,775 posts, representing 12.41% of total posts.
- Sunday: 1,075,702 posts, the lowest volume day at 11.5% of all posts.
Conclusions
What stands out isn’t just that midweek leads, but how evenly posting is spread across weekdays. From Monday through Friday, posting volume barely changes. The gap between the most active day (Wednesday) and the least active weekday (Monday) is less than one percentage point.
That pattern suggests teams aren’t randomly choosing days. They’re scheduling content for the moments they believe audiences are most active and responsive. Midweek has long been associated with higher feed activity, which explains why Tuesday through Thursday attract the most scheduled posts.
Weekends tell a different story. Saturday and Sunday account for less than a quarter of all posts, with Sunday at the bottom. That doesn’t mean weekend audiences don’t exist. It means fewer teams expect strong, reliable engagement then, so they prioritize weekdays where attention is more predictable.
What time of day do users post on social media the most?
Based on the analysis of 9,360,007 posts, most social media content is published in the afternoon, with 3:00 PM being the most common posting time. That’s when scheduling activity peaks and stays high for several hours.

At 3:00 PM alone, 605,029 posts were published, which makes up 6.5% of all posts in the dataset. More broadly, the window between 2:00 PM and 5:00 PM accounts for over a quarter of all social media posts. This is when most teams seem to settle into publishing mode.
What this shows me is how closely social media scheduling follows the workday. Posting starts to pick up after lunch, peaks mid-afternoon, and then drops off again once the day winds down. Very few teams publish overnight, and early mornings are used sparingly.
Here’s how social media posting volume evolves through the day:
- 3:00 PM is the most popular hour of the day for publishing social media content, with 605,029 posts, representing 6.5% of all posts analyzed.
- The four-hour window between 2:00 PM and 5:00 PM accounts for over 25% of all social media posts, signaling a strong industry preference for afternoon publishing.
- Only 14.9% of all social media posts are published between midnight and 5:00 AM, making early morning the least active posting window of the day.
- 10.53% of all social media posts are published between 7:00 AM and 9:00 AM.
- 13.79% of all social media posts are published between 10:00 AM and 12:00 PM.
Conclusions
The key pattern here is how strongly teams cluster around the same time window. Afternoons, especially between 2:00 PM and 5:00 PM, dominate scheduling because they’re widely seen as peak attention hours. By mid-afternoon, audiences are active, feeds are moving, and posts are more likely to be seen quickly.
This isn’t about habit or routine. It’s about expectation. Teams schedule posts when they believe engagement potential is highest, and over time, those beliefs reinforce the same afternoon-heavy posting patterns across platforms.
The downside is competition. When a quarter of all posts go out in the same four-hour window, standing out gets harder. Early mornings and late nights are quieter, not because they’re unusable, but because fewer teams expect consistent engagement there.
The opportunity is in testing. For brands willing to publish outside the afternoon peak, lower-volume hours can mean less noise and more visibility, without increasing how often they post.
Which social media platforms are driving the most growth in 2026?
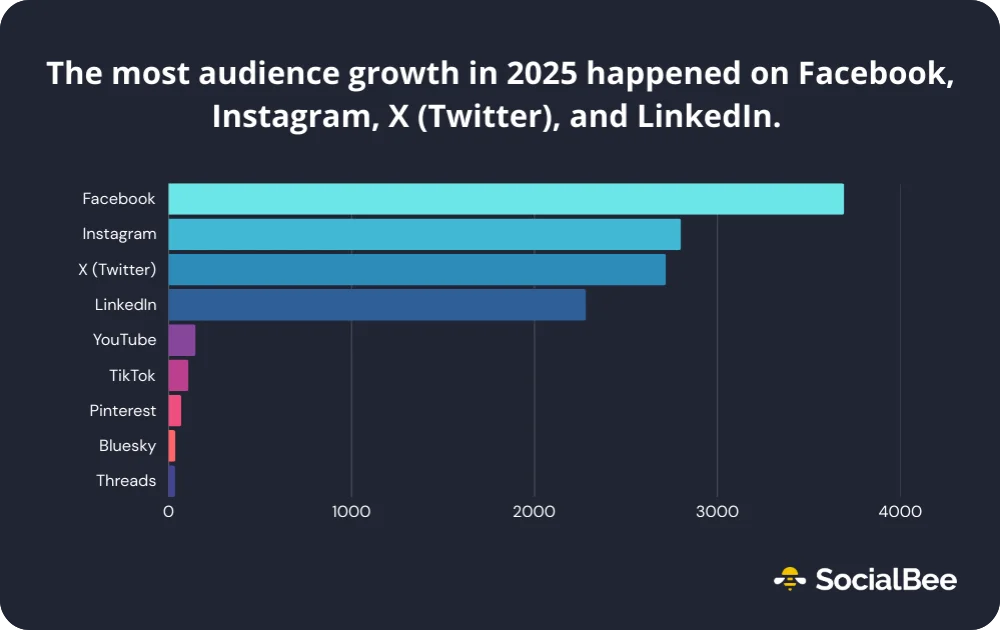
Based on the analysis of 11,909 users managing multiple social media accounts, most audience growth in 2025 happened on Facebook, Instagram, X (Twitter), and LinkedIn.
Growth was measured using each platform’s main audience metric, such as followers, likes, connections, or subscribers.
The social media platforms with the highest growth:
- Out of 11,909 multi-account users analyzed, over 96% of all growth occurred on Facebook, Instagram, X, and LinkedIn, confirming that established platforms continue to dominate audience expansion.
- Facebook represented 31.0% of all growing social profiles in the analysis, making it the most common platform where users experienced measurable growth.
- Instagram accounted for 23.5% of growing profiles, while X followed closely at 22.8%.
- LinkedIn made up 19.2% of all profiles that experienced growth, highlighting its continued strength for professional brands, companies, and personal profiles alike.
- YouTube accounted for 1.2% of growth, followed by TikTok at 0.9%, with Pinterest and the combined Bluesky and Threads each at 0.6%.
Conclusions
What stands out to me isn’t just which platforms are growing, but how concentrated that growth really is.
Despite ongoing conversations about emerging networks, nearly all measurable audience growth is still happening on the same platforms teams have relied on for years.
Smaller or newer platforms aren’t failing. They’re just growing more slowly and often in ways that don’t show up as clearly in short-term social media metrics.
For most brands, consistent growth still comes from showing up regularly on established platforms, not from spreading limited effort across every new network.
Which types of social media posts get the most engagement?
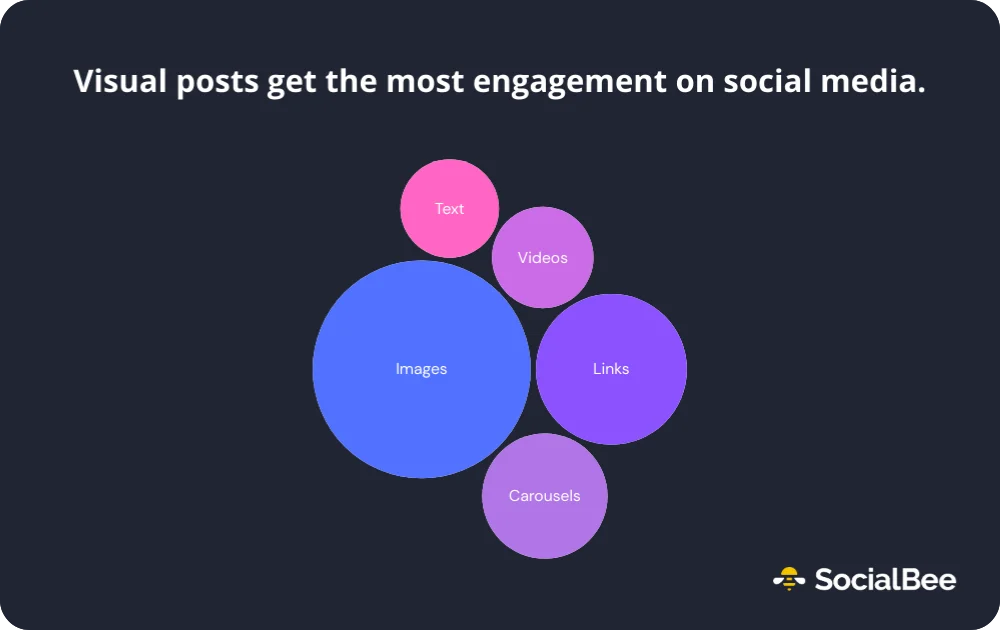
Based on the analysis of engagement data from 11,322 users, visual posts get the most engagement on social media, with images leading by a wide margin. Image posts account for 44.8% of all high-engagement content, while images and carousels together make up nearly 60% of top-performing posts across platforms.
Engagement is defined as the sum of all interactions on a post, including likes, comments, shares, clicks, and similar actions.
The most engaging social media post types:
- Out of all high-performing posts, 44.8% were image-based, making images the most consistently engaging post type across platforms.
- Link posts accounted for 21.5% of all top-performing posts, showing that external content can still generate strong engagement when paired with the right context or caption.
- Carousel posts accounted for 14.8% of all high-engagement posts, outperforming both video and text formats.
- Video (9.7%) and text posts (9.1%) generated nearly identical shares of high-engagement content, highlighting that format matters less than message quality.
- Visual-first content continues to be the most reliable driver of engagement across social platforms. Images and carousels alone account for nearly 60% of all high-engagement posts
Conclusions
It’s surprising to see how close video and text actually are. Even with the industry push toward short-form video, the data shows teams still earn high engagement from strong images, carousels, and sharp text.
Text posts generate almost the same share of high engagement as videos, which is a good reminder that what you say still matters more than how flashy the format is.
Strong copy can hold its own, especially when the message is timely, opinionated, or clearly useful. Rather than chasing every new format, it’s usually more effective to focus on saying something people actually want to react to.
How many social media accounts does one brand manage on average?
Based on the analysis of 12,291 SocialBee users, brands manage an average of 4.5 social media accounts at the same time. More than half of users manage three or more accounts, and a significant number handle far more than that.
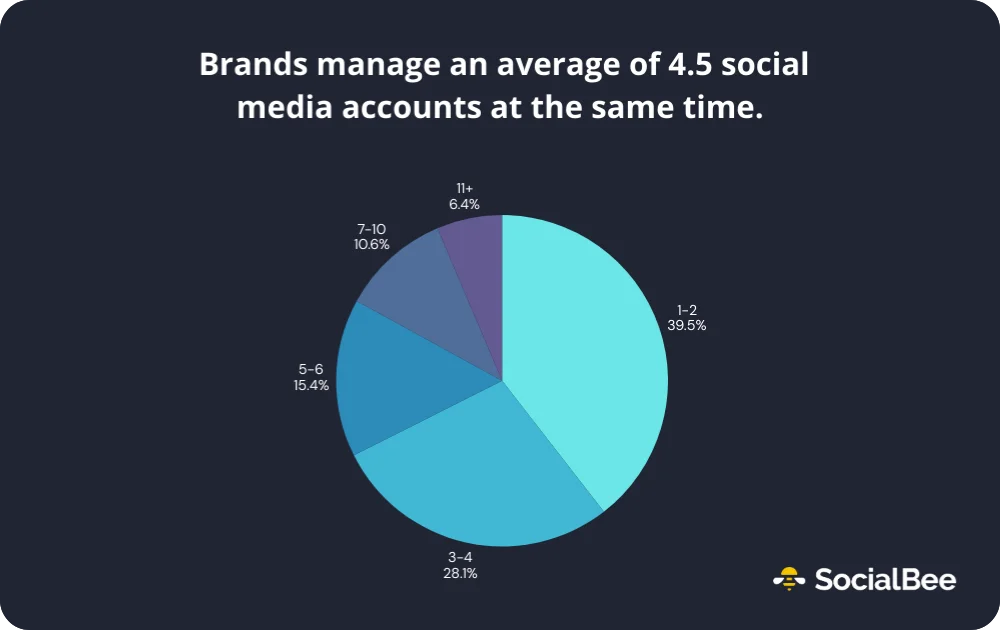
To put that into context, nearly 61% of users manage at least three social media accounts, while 17% manage seven or more. A smaller but still meaningful group, 6.4% of users, are juggling 11 or more accounts at once.
How many social media accounts the average user manages:
- 39.5% of users manage 1-2 social media accounts
- 28.1% of users manage 3-4 social media accounts
- 15.4% of users manage 5-6 social media accounts
- 10.6% of users manage 7-10 social media accounts
- 6.4% of users manage 11 or more social media accounts
Conclusions
For most users, social media is about switching between brands, platforms, or clients all day long. That reality explains a lot of the patterns in this report, from conservative posting schedules to heavy reliance on familiar formats.
When you’re managing four, seven, or even ten accounts, efficiency starts to matter more than experimentation.
Teams gravitate toward workflows that are repeatable and predictable. Posting consistently across multiple platforms often takes priority over trying something new on just one of them.