

X, formerly Twitter, has changed significantly since Elon Musk bought Twitter in 2022, but it remains a major part of the social media landscape. People still turn to the platform for breaking news, current events, political discourse, pop culture, entertainment, and real-time conversations with brands, creators, and other users.
For marketers, however, X statistics need more context than a headline about whether the platform is growing or declining. Changes to the user base, advertising business, engagement patterns, and platform features all affect whether X makes sense for your target audience and what role it should play in your social media marketing strategy.
In this guide, we’ve gathered the most important Twitter statistics for 2026, covering demographics, Twitter usage, engagement, video content, advertising, marketing, and influencer marketing. We’ll also show you how to turn those key figures into practical decisions about what to post, who to target, and how to measure your results.

We’re SocialBee LABS SRL, part of WebPros. We use the information you provide to share relevant content & updates, as outlined in our Privacy Policy. You can opt out anytime.
Short summary
- 33% of US internet users aged 18 to 29 use X, while people aged 25 to 34 make up 37.5% of the platform’s global audience.
- 64.4% of X users are male, giving the platform a noticeable gender gap.
- SocialBee users published 1.38 million X posts, representing 14.8% of the 9.3 million posts analyzed.
- X accounted for 22.8% of observed social media account growth among SocialBee users managing multiple platforms.
- The average X post generates 2,711 impressions, 32.89 likes, 2.56 replies, and 6.67 retweets.
- Overall Twitter engagement increased by 19%, even as average impressions declined.
- More than 100 million X users watch vertical video every day, and video now accounts for 42% of media posts.
- X ads have a potential reach of 586 million users, equivalent to 7.1% of the world’s population.
- Among the key Twitter marketing statistics, X generated an estimated $1.8 billion in advertising revenue, showing that advertising remains an important contributor to the platform’s annual revenue.
- 82% of major news influencers studied by Pew Research Center were active on X, highlighting the platform’s continued role in creator-led news and commentary.
Twitter demographics
X’s user base skews young and male, although the platform still reaches adults across a broad range of demographics. These Twitter statistics can help brands determine whether the platform’s audience overlaps with the people they want to reach.
1. 33% of US adults aged 18 to 29 use X
33% of US adults between the ages of 18 and 29 use X, formerly Twitter, according to June 2025 data.
This makes younger adults an important part of the platform’s audience in the United States. For brands targeting Gen Z users and young professionals, X can provide access to an audience already accustomed to using social media for current events, entertainment, brand interaction, and online conversations.
However, this figure represents the share of US adults in this age group who use X, not the share of all X users who are 18 to 29. Keeping that distinction in mind is important when comparing Twitter demographics.
2. 64.4% of X users are male
Men accounted for 64.4% of X’s global audience as of October 2025, meaning more than half of the platform’s users are male.
The gender gap is substantial, with male users representing close to two-thirds of the global user base.
For social media professionals, this demographic split provides useful context when assessing audience fit. If your target audience differs significantly from X’s overall gender distribution, check your own account demographics before assuming the platform average reflects the people your brand actually reaches.
3. 37.5% of X users are between 25 and 34 years old
People aged 25 to 34 made up 37.5% of X’s global audience as of February 2025, making them the platform’s largest age group.
Users aged 18 to 24 represented another 32.1%. Combined, these two groups accounted for 69.6% of X’s global audience, showing how heavily the platform’s user base is concentrated among younger users.
That makes X particularly relevant for brands whose target audience includes people under 35. Still, age alone shouldn’t determine whether you invest in the platform. Consider these figures alongside location, interests, and your own audience data to understand whether X users match the customers you want to reach.
Twitter usage statistics
People come to X for a mix of news, opinions, entertainment, and real-time conversations. But how does that translate into actual platform activity? These Twitter usage statistics give us a better idea of how X fits into people’s social media habits and how actively brands are still publishing there.
4. 1.38 million X posts were published through SocialBee in 2025
SocialBee users published 1,378,509 posts on X in 2025, representing 14.8% of the 9.3 million posts included in our analysis.
That made X the second-most-used platform in SocialBee’s dataset, behind Facebook. So, despite all the uncertainty surrounding Twitter’s future, brands and social media professionals are still actively creating content for the platform.
5. X generated 22.8% of the account growth observed by SocialBee
X accounted for 22.8% of all social media account growth observed among SocialBee users managing multiple platforms.
Together, Facebook, Instagram, X, and LinkedIn generated more than 96% of the growth in the dataset.
This is a useful reminder that X isn’t necessarily a platform where audiences have stopped growing. If you’ve been questioning whether it’s still worth investing in, check your own follower trends before writing it off. Your account may tell a very different story from the headlines.
6. The X app recorded 30.44 million downloads in Q3 2025
X Corp.’s apps generated 30.44 million downloads worldwide in the third quarter of 2025.
That’s a sizable number of downloads for a social app that has spent the past few years competing with newer alternatives and dealing with major changes to its product and brand.
Just keep in mind that downloads aren’t the same as active users. Someone can install the Twitter app without becoming a regular user, reinstall the app, or download it on more than one device. This figure is better used as a sign of continued interest in X than as a measure of the platform’s active user base.
7. Nearly half of X users follow news outlets and journalists
Nearly half of X users surveyed in 2025 said they pay attention to content from mainstream news outlets and journalists.
Interestingly, roughly the same share said they pay attention to creators and personalities such as celebrities and influencers.
That mix says a lot about what makes X different from other social media platforms. A breaking news story can sit next to a creator’s reaction, a meme, an expert’s analysis, and thousands of replies about the same event.
Brands don’t need to jump into every trending conversation. But if current events, industry news, or pop culture overlap naturally with what your audience cares about, timely posts can give you opportunities that a completely pre-planned content calendar would miss.
8. X users spend an average of 28 minutes per day on the platform
Daily active users spend an average of 28 minutes per day on X.
That’s almost half an hour of scrolling through news, replies, videos, opinions, memes, and brand content.
Getting a piece of that attention isn’t just about posting tweets more often. X moves quickly, so content needs to give users a reason to stop. That could be a useful observation, a strong opinion, a timely response, an entertaining post, or video content that makes sense without asking someone to leave the feed.
Twitter engagement statistics
X posts are getting slightly fewer impressions, but the engagement picture is more positive. Likes, replies, retweets, and overall engagement have all increased, suggesting that reach alone doesn’t tell the full story of how content performs on the platform.
9. The average X post gets 2,711 impressions
Posts on X generate an average of 2,711 impressions, compared with 2,864 the previous year.
That works out to a decrease of roughly 5%. While getting your content seen matters, the engagement numbers show why impressions shouldn’t be evaluated on their own. Posts can reach fewer users and still generate stronger reactions from the people who see them.
10. The average X post receives 32.89 likes
X posts receive an average of 32.89 likes, 2.56 replies, and 6.67 retweets.
Likes increased from 30.25 the previous year, while replies and retweets also moved upward.
Each metric can tell you something different. Likes show quick interest, replies point to conversation, and retweets show that people found a post worth sharing with their own audience. Looking at them separately can help you understand why a post performed well instead of relying on one engagement number.
11. Overall engagement on X increased by 19%
Overall Twitter engagement increased by 19%, while interactions grew by 12%.
This is particularly notable alongside the decline in average impressions. Content isn’t necessarily reaching more people, but users are interacting with what they see more often.
When analyzing your own posts, pay attention to that relationship. A post that generates fewer impressions but considerably more replies, retweets, or clicks may be more useful to your social media strategy than one that earns broad reach and little response.
12. The best times to post on X are Thursday and Friday from 9 AM to 4 PM EST
Thursday and Friday between 9 AM and 4 PM EST are among the best times to post on X.
Rather than narrowing your schedule down to one supposedly perfect posting time, use this window as a starting point and test when your audience is most responsive.
And timing on X isn’t only about the clock. If you’re posting about breaking news, current events, or a conversation unfolding in your industry, publishing while people are talking about it will usually make more sense than waiting for your regular posting slot.
Twitter video statistics
Video is taking up a bigger share of what people see and do on X. Vertical video in particular has become a significant part of daily Twitter usage, while brands are publishing more video content and seeing stronger conversion results from short-form formats.
13. More than 100 million X users watch vertical video every day
More than 100 million social media users watch vertical video on X each day, using the format to follow what’s happening around them.
On many days, vertical video accounts for more than 20% of total platform usage. That’s a substantial portion of activity for a format that now has to compete with everything from text posts and images to breaking news and live conversations.
14. 42% of media posts on X are videos
Video now accounts for 42% of media posts on X, following a 40% year-over-year increase.
That means nearly half of posts containing media are now videos. The jump also shows how quickly video has become part of the content mix on a platform historically associated with short text updates.
If your X strategy is still mostly text and static images, video is worth adding to your testing mix. You don’t need to turn every idea into a video, but topics that benefit from a demonstration, personality, movement, or visual explanation are natural places to start.
15. Short-form brand videos drive 41% higher conversion rates on X
Short-form brand videos on X generate 41% higher conversion rates than non-video content.
This gives video a role beyond views and Twitter engagement. For campaigns designed to drive an action, short-form video can help communicate the message quickly while keeping users within the fast-moving experience they’re accustomed to on X.
Keep the creative focused. Lead with the product, idea, or message you want people to remember rather than spending the opening seconds setting up the video. On X, where users are moving quickly between different formats and conversations, the strongest part of the video shouldn’t be saved for the end.
Twitter marketing and advertising statistics
X still gives marketers access to hundreds of millions of potential customers, but its biggest differentiator is the context surrounding those ads. Users are already following products, news, trends, creators, and conversations, giving brands opportunities to appear while people are actively paying attention to a topic.
16. X ads can reach 586 million users
X ads had a potential reach of 586 million users worldwide in January 2025.
That gives brands a sizable advertising audience, particularly when X’s demographics overlap with their target market.
X also offers targeting based on interests, keywords, conversations, follower look-alikes, demographics, and other signals, so marketers can narrow that potential audience rather than trying to reach all 586 million users.
17. X ads can reach 7.1% of the world’s population
X’s potential ad reach is equivalent to 7.1% of the global population.
Scale isn’t X’s strongest selling point compared with the world’s biggest social media platforms, but reaching the largest audience isn’t always the objective.
What matters is how much of your target audience you can reach. For brands whose customers overlap with X’s younger and male-skewing user base, that 7.1% can still represent a significant advertising opportunity.
18. X generated an estimated $1.8 billion in advertising revenue
X generated approximately $1.8 billion in advertising revenue in 2025.
Advertising therefore continues to be an important source of Twitter’s revenue, alongside subscriptions and the other products X has introduced since Elon Musk bought Twitter.
For advertisers, X supports campaigns built around reach, video views, engagement, website traffic, app installs, and other objectives. Marketers can then measure metrics such as reach, clicks, installs, engagement rate, and cost per action to see whether that ad spend is producing the intended result.
19. X users are 7x more likely to engage with ads in vertical video
X users are 7x more likely to follow, repost, like, or click the URL of an ad shown in vertical video compared with the same ad on the Home Timeline.
This fits with the wider shift toward video content we’ve already seen on X. More than 100 million users watch vertical video every day, giving advertisers another placement to test beyond the traditional feed.
If you’re already creating vertical ads for other social media platforms, testing them on X is also becoming easier. X now supports several common image and video aspect ratios, including 9:16, 4:5, 1:1, and 16:9, so existing creative can be reused without rebuilding it specifically for the platform.
20. X users are 45% more likely to buy products they see advertised
X users are 45% more likely to purchase products they’ve seen advertised than people using other social media platforms, according to research cited by X.
That makes X worth looking at beyond awareness and Twitter engagement. If you’re running conversion-focused campaigns, measure how those ads translate into website activity, purchases, leads, or other actions that matter to your business.
X provides both Pixel and Conversion API options for tracking what users do after interacting with an ad, including actions such as adding an item to their cart or making a purchase.
21. X holiday shoppers are 24% more likely to recommend products to others
Holiday shoppers on X are 24% more likely to share product recommendations with other people.
They’re also 32% more likely to try new products first and 39% more likely to purchase advertised products than non-X users, according to X’s holiday shopping research.
That combination is useful for social media marketing because purchases aren’t happening in isolation. People on X can discover something, discuss it, recommend it, and influence someone else’s decision within the same conversation.
For product launches and seasonal campaigns, give people something worth talking about instead of treating X solely as another place to distribute ads.
Twitter influencer statistics
Influencer marketing on X looks different from Instagram or TikTok. Creators aren’t limited to polished sponsored posts or product videos. They can build influence through commentary, expertise, news, opinions, and ongoing conversations with their followers.
Research into news influencers gives us an especially useful look at how influential creators operate on X.
22. 82% of major news influencers are active on X
82% of the news influencers studied by Pew Research Center had an X account in early 2025.
Pew defines news influencers as people with at least 100,000 followers who regularly post about current events or civic issues. Even as some expanded to newer social apps such as Bluesky, X remained widely used among this group.
For brands working in industries where expertise, breaking news, commentary, or current events matter, influencers on X can offer something different from traditional lifestyle creator partnerships. Their value often comes from being part of conversations people are already following.
23. 83% of X news influencers post at least four days per week
83% of news influencers on X posted four or more days per week on average during the first three months of 2025.
Another 6% posted between one and three days per week, leaving just 11% who didn’t post regularly or at all.
That level of activity makes sense on X. Influence is built through ongoing participation rather than occasional standalone posts, particularly when creators cover fast-moving topics.
Brands choosing influencers should therefore look beyond the number of followers. Pay attention to how regularly creators post, whether their followers respond, and how naturally they participate in conversations relevant to your product or industry.
24. 96% of sponsored influencer posts identified on Twitter were undisclosed
A 2025 peer-reviewed study found that 96% of sponsored influencer posts it identified on Twitter were not disclosed as sponsored content.
The researchers analyzed a dataset of more than 100 million Twitter posts across a large set of brands. Even using a more conservative classification, they estimated that at least 82% of sponsored posts went undisclosed.
That’s a striking influencer marketing statistic, but also a warning for brands. A partnership shouldn’t become less transparent simply because sponsored content on X can look like an ordinary post or conversation.
If you’re working with X creators, make disclosure requirements part of the campaign brief from the beginning. Clear sponsorship disclosure protects the audience and removes ambiguity about what the creator was paid or incentivized to promote.
How to use X statistics to improve your social media strategy
Platform-wide X statistics are useful for understanding where Twitter ranks in the broader social media landscape, but averages can only tell you so much. Your own account data shows whether the platform is actually delivering results for your brand.
Here’s how to put both types of data to work.
1. Compare your X performance with your other social media platforms
Don’t evaluate X in isolation. Compare its performance with Facebook, Instagram, LinkedIn, TikTok, and any other platforms your brand actively uses.
Start with the metrics that connect to your goals, such as:
- Impressions and reach
- Engagement rate
- Replies and reposts
- Follower growth
- Link clicks and website traffic
- Leads and conversions
Then look at what each platform contributes.
For example, Instagram might generate more interactions with visual brand content, while X sends more people to your website or creates more direct conversations around current events. In that case, a lower Twitter engagement rate wouldn’t necessarily mean X is underperforming. The platforms are simply doing different jobs.
This comparison also makes it easier to decide where your time and ad spend should go. Rather than maintaining an X presence because many brands use the platform, invest according to the results it produces for your business.
2. Use X demographics to determine who you should target
X’s overall demographics tell you who could encounter your content. Your account-level audience data helps you understand who you are actually attracting.
Start by comparing the platform’s audience with your ideal customer. Consider factors such as age group, location, gender distribution, interests, and the presence of younger users or Gen Z users where relevant.
Then compare those broader statistics with your own X analytics.
If your target audience is well represented among X users but isn’t interacting with your account, the problem may be your content rather than the platform. Revisit the topics you cover, the accounts you interact with, your positioning, and the conversations you join.
The goal isn’t simply to attract more Twitter users. It’s to build an audience that makes sense for your business.
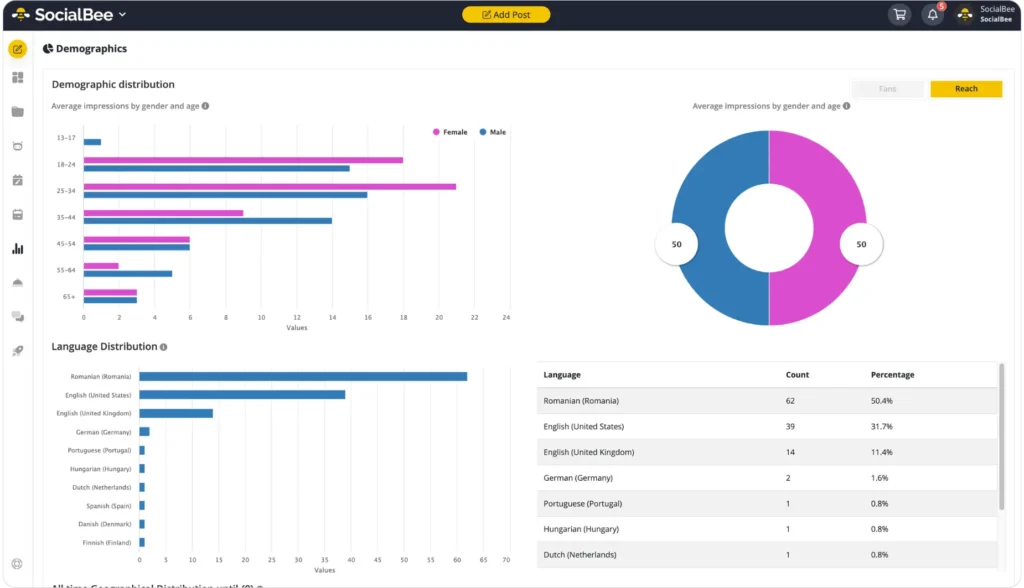
Use SocialBee‘s audience insights to see the demographics of the people following your X account, including factors such as age, gender, and location. Compare these demographics with your target audience to identify whether you’re attracting the right people and where there may be gaps.
3. Identify which types of X posts deserve more of your attention
A single tweet can perform very differently depending on its topic, timing, format, and the conversation happening around it. That’s why you shouldn’t use platform-wide engagement benchmarks as a formula for what to post.
Instead, use the Twitter engagement and video statistics in this article to identify different formats worth testing, then compare them using your own data.
Look at how text posts, images, video content, links, polls, and other formats perform for metrics such as engagement rate, replies, reposts, clicks, and conversions.
Don’t stop at format, either.
Suppose your three strongest posts are videos. If all three cover breaking events in your industry, the subject matter may be driving performance just as much as the video format. Compare enough posts to separate genuine patterns from one-off successes.
Over time, this gives you a much stronger basis for deciding what deserves a larger share of your content calendar.
4. Adapt your strategy to X’s real-time conversations
X has always been closely associated with what is happening right now. Breaking news, live events, cultural moments, industry announcements, and pop culture conversations can develop quickly, which makes an overly rigid content calendar a poor fit for the platform.
Plan enough content to maintain consistency, but leave room to react.
That could mean commenting on a new development in your industry, joining a culturally relevant conversation, answering questions around breaking events, or responding quickly when people start discussing your brand.
The important part is relevance. A trending topic isn’t automatically a marketing opportunity. Joining an unrelated conversation simply because it is popular can make brand interaction feel forced.
A better system combines planned weekly posts with space for timely content. Evergreen posts keep your account active, while reactive posts allow your brand to participate when it genuinely has something useful, interesting, or entertaining to contribute.
Use SocialBee’s Content Categories to separate your planned X posts into themes such as evergreen tips, educational content, promotions, and industry news. This gives your content calendar structure without filling every available slot, so you can keep room for timely posts when relevant conversations, trends, or breaking news emerge.

5. Benchmark your performance against relevant X averages
Benchmarks help answer a useful question: Is this result unusual, or roughly what similar accounts experience?
Compare metrics such as engagement rate, posting frequency, follower growth, and video performance with the most relevant X benchmarks you can find. Where possible, narrow the comparison by account size, industry, or content format.
For example, comparing a small business’s engagement with the average number generated by a major media account with millions of followers won’t tell you much. The closer the benchmark is to your circumstances, the more useful it becomes.
And don’t treat an average as a score you have to beat.
If your engagement rate falls below a benchmark, investigate the reason. Look at your posting frequency, topics, formats, timing, and audience fit before deciding what needs to change. Likewise, exceeding an industry average doesn’t automatically mean your strategy is working if those interactions aren’t contributing to your actual marketing goals.
6. Track your X statistics consistently
A good month or a bad month rarely tells the whole story. Track your X performance consistently so you can distinguish long-term patterns from temporary spikes.
Add context whenever something significant changes. A viral post, product launch, campaign, change in posting frequency, major news event, or new content series can all explain why your numbers moved.
This is especially useful for social media professionals managing multiple accounts. Instead of reporting that impressions increased or engagement declined, you can explain what changed, what likely contributed to it, and what you’re going to test next.
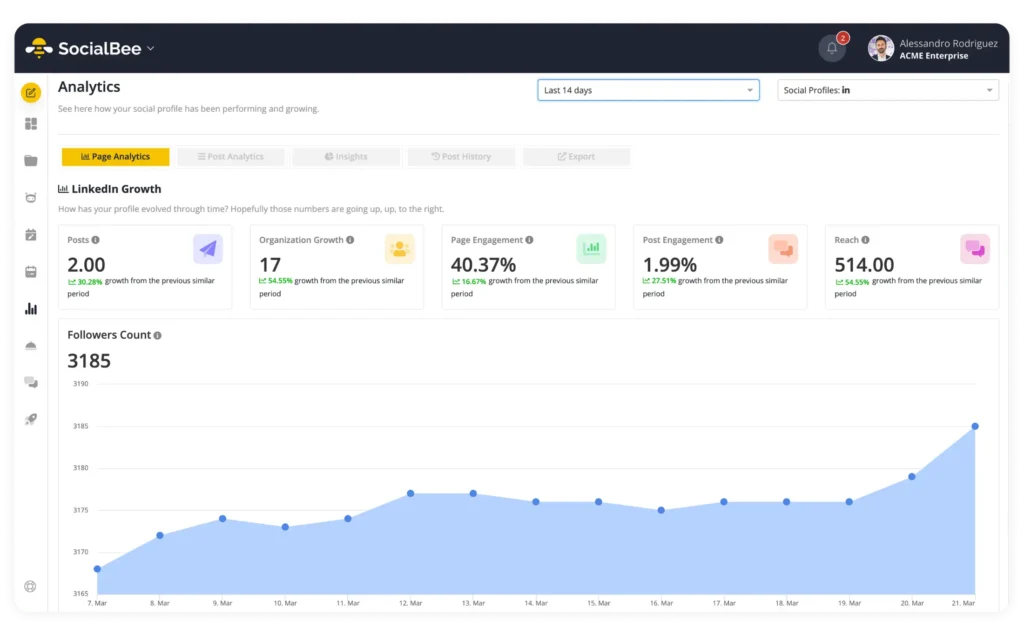
SocialBee’s analytics let you track your X performance alongside your other social media accounts, so you don’t have to build a separate reporting process for every platform. You can compare performance over time, identify your strongest content, and export PDF reports when you need to share results with clients, your team, or other stakeholders.
Twitter statistics provide the benchmark. Your own data provides the direction. Use both together to decide whether to publish more or less frequently, experiment with different formats, adjust your target audience, or rethink the role X plays in your wider social media strategy.
Frequently asked questions
1. How do I check my Twitter statistics?
You can check your Twitter statistics through X Analytics, where you can review metrics such as impressions, engagement, profile activity, video performance, and follower growth.
If you manage X alongside other social media platforms, SocialBee‘s analytics can help you track account and post performance from the same dashboard you use to manage your content.
2. Is Twitter growing or declining?
The picture is mixed. X has gone through significant changes since Elon Musk bought Twitter, but recent data shows continued activity and areas of growth.
For example, X Corp.’s apps recorded 30.44 million downloads in Q3 2025. SocialBee’s data also found that X generated 22.8% of the observed social media account growth among users managing multiple platforms. At the same time, average post impressions declined from 2,864 to 2,711, showing why growth depends on which metric you look at.
3. How many people left Twitter recently?
There isn’t a reliable public figure showing exactly how many people have recently left Twitter. X does not regularly publish comparable monthly active users or daily active users figures that would allow us to calculate a precise number.
Individual reports may estimate changes in the user base, but they shouldn’t be interpreted as a definitive count of how many people have stopped using X worldwide.
4. What content is most popular on X?
Video has become one of the most popular content formats on X. More than 100 million users watch vertical video each day, and on many days, vertical video represents more than 20% of total platform usage.
Video also accounts for 42% of media posts on X, following a 40% year-over-year increase.
5. What content performs the best on Twitter?
There isn’t one format that performs best for every X account, but the latest data makes short-form video particularly worth testing. Short-form brand videos have generated 41% higher conversion rates than non-video content, while users are 7x more likely to interact with ads shown in X’s vertical video feed than with the same ads on the Home Timeline.
Format is only part of the equation, though. On X, timely posts about breaking news, industry developments, current events, and culturally relevant conversations can also benefit from the platform’s real-time nature.
Use these Twitter statistics to grow on the platform
X has changed considerably from the Twitter many marketers built their original strategies around. But the latest statistics show that people are still posting, interacting, watching video, following news and creators, and discovering brands on the platform.
The opportunity is also becoming clearer. Overall engagement has increased even as average impressions have fallen, vertical video now takes up a significant share of platform usage, and X still offers brands access to hundreds of millions of potential customers through advertising.
Use these Twitter statistics as context for your strategy, then look at your own results to decide what deserves your attention. Track which topics and formats generate replies, reposts, clicks, and conversions, compare X with your other social channels, and leave enough flexibility in your calendar to participate in relevant conversations while they’re happening.
SocialBee can help you put that approach into practice. You can plan and schedule X posts alongside your other social media content, organize posts with the visual scheduler using content categories, and use analytics to see what’s actually working.
Start your 14-day free SocialBee trial and build an X strategy around what your audience responds to.