
LinkedIn statistics can tell you much more than how many professionals have created an account. They show who uses the world’s largest professional network, how people interact with LinkedIn posts, which content formats get attention, and why the platform remains important for B2B marketing, lead generation, recruiting, and advertising.
For marketers, it’s useful to know whether the platform’s users match the business professionals you need to reach and whether your content is turning that access into engagement, web traffic, high-quality leads, or stronger professional relationships.
This guide covers the latest LinkedIn stats on demographics, usage, content, advertising, recruiting, and marketing. We’ll also look at how to combine those broader benchmarks with your own LinkedIn data to make better decisions about your social media strategy.

We’re SocialBee LABS SRL, part of WebPros. We use the information you provide to share relevant content & updates, as outlined in our Privacy Policy. You can opt out anytime.
Short summary
- LinkedIn has more than 1.3 billion members worldwide, with people aged 25 to 34 making up its largest age group at 33.4%.
- LinkedIn accounted for 11.6% of the 9.3 million social media posts analyzed by SocialBee in 2025 and 19.2% of observed social media account growth.
- Companies that post weekly see 2x higher engagement, while complete LinkedIn Pages receive 30% more weekly views.
- Native documents have the highest average engagement rate at 7%, followed by multi-image posts at 6.45% and video posts at 6%.
- LinkedIn video is growing, with video creation up 27% and video views up 36% over the past year.
- LinkedIn remains a major B2B marketing channel: 87% of B2B marketers use it for marketing, while 89% use it for lead generation.
- LinkedIn’s advertising revenue is projected to reach $9.7 billion in 2026, while LinkedIn members have 2x the buying power of the average online audience.
- Recruiting remains central to LinkedIn usage, with 8,200 job applications submitted every minute and US applicants per open role doubling since spring 2022.
LinkedIn user demographics
LinkedIn’s audience reflects its position as the world’s largest professional network, with more than 1.3 billion members spanning professionals, companies, and educational institutions. Its user base is particularly concentrated among people aged 25 to 34.
1. LinkedIn has more than 1.3 billion members worldwide
LinkedIn has a global community of more than 1.3 billion members.
The platform also lists more than 144,000 schools and has a presence among approximately 100% of Fortune 500 companies, highlighting how broadly LinkedIn is used across the professional world.
Unlike monthly active users, however, LinkedIn members represent registered accounts rather than the number of people actively using the platform each month. Keep that distinction in mind when comparing LinkedIn’s user base with other social media platforms that primarily report active users.
2. 56.8% of LinkedIn users worldwide are male
Male users represented 56.8% of LinkedIn’s global user base as of October 2025.
This means most LinkedIn users are male, although the difference isn’t large enough to make the professional network relevant to only one gender.
For marketers, global LinkedIn demographics provide useful context, but your own audience data should ultimately determine who you create content for.
3. 33.4% of LinkedIn users are between 25 and 34 years old
People aged 25 to 34 make up 33.4% of LinkedIn users worldwide, making this the platform’s largest age group as of October 2025.
Young professionals aged 18 to 24 account for another 20.5% of LinkedIn’s user base. At the other end of the spectrum, users older than 55 represent just 1.8%.
These LinkedIn statistics show that younger professionals make up a significant portion of the platform’s audience. However, age alone doesn’t determine whether someone is valuable to a B2B strategy. Job title, seniority, industry, and purchasing influence can be more important when you’re trying to reach professional buyers.
4. One-third of US LinkedIn users have a bachelor’s degree or equivalent
One-third of LinkedIn users in the United States held a bachelor’s degree or equivalent, according to a February 2025 survey.
Another 18% held a master’s degree or equivalent.
For businesses using LinkedIn for content marketing, recruiting, or B2B lead generation, education data adds another layer to the platform’s professional demographics. As with age and gender, though, it should be treated as broad audience context rather than a description of every person you’ll reach.
LinkedIn usage statistics
LinkedIn usage extends well beyond maintaining a digital resume or searching for jobs. Millions of people view feed updates, apply for jobs, build professional relationships, and consume content on the platform, while SocialBee‘s data shows LinkedIn remains one of the most frequently used networks for brand publishing.
5. More than 1.8 million LinkedIn users view feed updates every minute
More than 1.8 million LinkedIn users viewed feed updates every 60 seconds as of March 2026.
During the same minute, more than 17,000 new connections were made, showing how actively LinkedIn members use the platform to consume content and build professional relationships.
For brands, that means LinkedIn posts compete within a busy professional feed. Publishing consistently can keep your company visible, but the content still needs to give business professionals a reason to stop scrolling, whether through useful expertise, industry insights, original data, or a strong point of view.
6. LinkedIn receives 8,200 job applications every minute
LinkedIn users submitted approximately 8,200 job applications every minute as of March 2026.
The statistic highlights how important LinkedIn recruiting and job discovery remain to overall platform usage. LinkedIn isn’t simply a content-focused social network. Job seekers, recruiters, companies, and professionals hired through the platform are all part of the same ecosystem.
That also affects content strategy. Employer branding, employee expertise, company culture, and industry knowledge can influence how potential applicants perceive a company before they ever reach a job listing.
7. LinkedIn accounted for 11.6% of posts published through SocialBee in 2025
LinkedIn accounted for 11.6% of the 9,332,840 social media posts analyzed by SocialBee in 2025. In total, SocialBee users published 1,083,542 LinkedIn posts during the year.
That made LinkedIn one of the four largest social media platforms for publishing volume in the dataset, alongside Facebook, X, and Instagram.
For marketers, this provides a useful view of actual publishing behavior rather than stated platform preferences. LinkedIn represents a meaningful part of the content calendars of brands managing several social networks at once.
8. LinkedIn accounted for 19.2% of growing social profiles
LinkedIn represented 19.2% of all profiles that experienced measurable audience growth in SocialBee’s analysis of 11,909 multi-account users.
Alongside Facebook, Instagram, and X, LinkedIn was part of a group responsible for more than 96% of all observed social media account growth in the dataset.
This shows that brands are continuing to grow audiences there, making the platform relevant for businesses trying to expand their professional network and reach new potential customers.
9. LinkedIn pages with more than 100,000 followers publish about 43 posts per month
LinkedIn accounts with more than 100,000 followers published an average of 43.48 posts per month in 2025.
By comparison, small accounts with up to 1,000 followers published an average of just 0.98 posts per month.
The difference shows how dramatically LinkedIn posting frequency can vary with account size. Larger pages have more resources, established audiences, and more reasons to maintain a frequent publishing schedule.
For smaller accounts, the statistic shouldn’t be interpreted as a requirement to suddenly post daily. Instead, compare your publishing frequency with your results. If posting more consistently leads to sustainable improvements in reach, engagement, and user growth, increase frequency gradually rather than chasing the output of much larger company pages.
LinkedIn engagement statistics
LinkedIn engagement increased in 2025, but publishing habits and content formats can make a noticeable difference. Complete company pages, consistent posting, and visual content all show stronger engagement signals.
10. The average LinkedIn post received 1.74 engagements in 2025
The average LinkedIn post received 1.74 instances of engagement in 2025, up from 1.57 in 2024.
The year-over-year increase suggests LinkedIn users are interacting more with content on the professional network. However, a platform-wide average shouldn’t be treated as a target for every company page.
Account size, audience, posting frequency, and content type can all influence LinkedIn engagement. Compare the wider benchmark with your own historical data to determine whether interactions with your posts are actually increasing.
11. Complete LinkedIn Pages receive 30% more weekly views
LinkedIn Pages with complete information receive 30% more weekly views than incomplete pages.
Before focusing entirely on content performance, make sure the basics of your company page are covered. Providing complete and accurate information makes it easier for LinkedIn members to understand who you are and what your organization does when they reach your page.
Treat your LinkedIn profile or company page as more than a digital resume. Keep company information, branding, descriptions, and other relevant details current so that increased visibility from your content leads people to a useful destination.
12. Companies that post weekly on LinkedIn see 2x higher engagement
Companies that post weekly see a 2x lift in engagement with their LinkedIn content.
That makes consistency an important part of a LinkedIn social media strategy. Publishing once and disappearing for several weeks gives you fewer opportunities to reach your audience and learn what they respond to.
This doesn’t mean every company needs to post daily. Start by maintaining a schedule you can realistically sustain, then use your LinkedIn data to determine whether increasing frequency improves engagement and audience growth.
13. LinkedIn image posts generate 2x more comments
LinkedIn posts with images typically generate a 2x higher comment rate.
LinkedIn has also found that custom collages containing three to four images can perform particularly well for organizations.
For content marketing teams, this makes images worth testing when the visual adds context to the post. Event photos, original charts, product visuals, employee content, and behind-the-scenes images can give LinkedIn users more to react to than text alone.
Don’t add an image purely to satisfy the format, though. Compare image posts with your text, document, and video content to see whether the same advantage appears with your audience.
14. Video posts average 3.97 shares for LinkedIn accounts with 10,000 to 50,000 followers
LinkedIn video posts from accounts with 10,000 to 50,000 followers received an average of 3.97 shares as of January 2024, compared with 3.36 shares for image posts.
Account size also matters. Pages with 50,000 to 55,000 followers recorded the highest average number of shares regardless of content format among the account sizes analyzed.
For marketers investing in video content, shares can be particularly useful because they indicate that a viewer found the post relevant enough to distribute to their own professional network. Track shares alongside views and overall engagement to understand whether your video posts are simply being watched or actively spreading beyond your existing audience.
LinkedIn video statistics
Video is becoming a bigger part of LinkedIn content, with both creation and views growing considerably over the past year. The format also generates meaningful engagement for company pages, while investment in paid video ads continues to rise.
15. LinkedIn video creation increased by 27% in one year
Video creation on LinkedIn increased by 27% over the past year, showing that more members and brands are incorporating video content into their LinkedIn posts.
The increase comes as businesses compete for attention in a feed traditionally associated with text and image posts. Interviews, expert commentary, product demonstrations, event clips, and educational videos all give companies opportunities to communicate professional topics in a more visual format.
For marketers, though, higher platform-wide adoption isn’t a reason to create video for its own sake. Compare your video uploads with other formats and invest more when the additional production effort produces better results.
16. LinkedIn video views increased by 36%
LinkedIn video views increased by 36% over the past year, outpacing the 27% increase in video creation.
That difference suggests demand for video is growing alongside supply. For B2B marketers, it makes video worth testing as part of a broader content marketing strategy rather than treating LinkedIn as an exclusively text-based professional network.
Track views alongside engagement, shares, clicks, and leads. A high view count can demonstrate reach, but the more important question is whether those viewers take the actions your business wants.
17. LinkedIn videos have an average engagement rate of 6%
LinkedIn video posts recorded an average engagement rate by impressions of 6% in 2025, up from 5.6% in 2024.
Video ranked third among the content formats analyzed, behind native documents at 7% and multi-image posts at 6.45%. It still performed ahead of image posts at 5.3%, text posts at 4.5%, polls at 4.2%, and link posts at 3.25%.
Combined with the 36% increase in video views, these LinkedIn stats make a strong case for testing more video content. But video isn’t automatically the best format for every company page. Compare your own video posts with documents, images, and other formats to see whether the additional reach translates into engagement, clicks, or leads for your business.
18. Paid video on LinkedIn grew nearly 30% year over year
Paid video on LinkedIn grew nearly 30% year over year, indicating that advertisers are putting more resources behind video campaigns.
For LinkedIn advertisers, video ads can support both brand and acquisition messages, depending on the campaign objective and creative. However, growing advertiser adoption doesn’t mean paid video ads will automatically outperform other formats.
Compare video campaigns with your other LinkedIn ads using metrics tied to the objective, such as view rates and engagement for awareness campaigns or clicks, leads, and conversions for acquisition campaigns.
LinkedIn advertising statistics
LinkedIn advertising gives brands access to a professional audience with considerable purchasing influence. The platform’s ad revenue is also projected to continue growing as more businesses invest in reaching professional buyers.
19. LinkedIn ads can generate a 2x to 3x lift in brand attributes
Brands see a 2x to 3x lift in brand attributes when advertising on LinkedIn.
This makes LinkedIn ads relevant beyond immediate lead generation. Campaigns can also support awareness and influence how professional buyers perceive a company.
20. LinkedIn ad revenue is projected to reach $9.7 billion in 2026
LinkedIn’s advertising revenue is forecast to reach approximately $9.7 billion in 2026, up from an estimated $8.3 billion in 2025.
That represents an increase of roughly $1.4 billion in a single year, reflecting continued advertiser investment in the professional network.
Growing LinkedIn revenue doesn’t indicate whether the platform will be cost-effective for a particular business. Compare LinkedIn’s cost per click, lead, and conversion with other platforms and evaluate those costs against lead quality and eventual business value.
21. LinkedIn ads can reach 14.7% of the world’s population
LinkedIn ads can reach an audience equivalent to 14.7% of the world’s total population.
That gives advertisers substantial potential reach, but LinkedIn’s real advantage is the professional context of its user base. Campaigns can be built around characteristics relevant to B2B marketing, helping businesses focus their budget on the professionals they want to reach.
Large potential reach therefore matters less than relevant reach. For B2B lead generation, reaching a smaller group with the right job titles and professional characteristics may be more valuable than generating millions of poorly targeted ad impressions.
22. LinkedIn members have 2x the buying power of the average online audience
LinkedIn members have twice the buying power of the average web audience.
This helps explain why LinkedIn advertising statistics shouldn’t be evaluated solely on cost. LinkedIn ads may be more expensive than advertising on some other social media platforms, but the value of reaching professional buyers can justify that difference for certain businesses.
Focus on the full economics of your LinkedIn campaigns. A higher cost per lead can still produce a better result if LinkedIn delivers high-quality leads that are more likely to become valuable customers.
LinkedIn marketing statistics
LinkedIn has become a central channel for B2B marketers, particularly for thought leadership and lead generation. Its professional audience gives companies a place to distribute expertise while reaching people in a business mindset.
23. 87% of B2B marketers use LinkedIn for marketing
87% of B2B marketers use LinkedIn for marketing, making it the most-used social media platform among the B2B marketers surveyed by Statista.
The figure reinforces LinkedIn’s position as an important social media platform for companies trying to reach other businesses.
High adoption also means more competition. Simply publishing company updates isn’t enough to stand out. B2B marketers need content that gives their LinkedIn audience useful expertise, original insights, or a reason to participate in the conversation.
24. 76% of marketers consider LinkedIn an effective channel for thought leadership
76% of marketers identify LinkedIn as one of their most effective channels for publishing thought leadership.
That fits naturally with how people use the platform. LinkedIn members are already there to follow professional conversations, learn about their industries, and build professional relationships.
Thought leadership should offer more than polished brand messaging. Original research, expert perspectives, practical lessons, and informed opinions can give business professionals something worth engaging with and sharing with their own networks.
25. 89% of B2B marketers use LinkedIn for lead generation
89% of B2B marketers use LinkedIn for lead generation, while 62% say the platform actually generates leads for them.
This distinction between usage and results matters. LinkedIn isn’t simply a place where B2B marketers try to generate leads. A lot of marketers report that it delivers them.
Still, lead volume shouldn’t be the only measure of success. Track whether LinkedIn produces high-quality leads that progress through your funnel and become customers.
LinkedIn recruiting and hiring statistics
LinkedIn recruiting data shows a hiring environment where candidates face more competition while employers are increasingly looking beyond traditional credentials. Skills-based hiring, recruiter outreach, and profile signals such as #OpenToWork can all influence how employers and job seekers use the professional network.
26. US applicants per open role have doubled since 2022
The number of US applicants per open role on LinkedIn has doubled since spring 2022.
For job seekers, more applicants per opening means greater competition for attention. A complete LinkedIn profile that clearly communicates relevant skills and experience can help recruiters understand a candidate’s fit without relying solely on their job title.
For employers, higher application volume creates the opposite challenge: identifying qualified candidates efficiently among a larger pool.
27. Companies using more skills-based searches are 12% more likely to make a quality hire
Companies conducting the most skills-based searches on LinkedIn are 12% more likely to make a quality hire, according to LinkedIn data.
Rather than limiting searches to previous job titles, degrees, or specific career paths, skills-based recruiting gives employers another way to identify people who have the capabilities required for a role.
The shift can also increase the potential candidate pool by surfacing professionals whose experience matches the job even if their employment or education history doesn’t follow the conventional route.
28. 26% of paid LinkedIn job posts don’t require a degree
26% of paid job posts on LinkedIn didn’t require a degree in 2023, up from 22% in 2020.
While the increase is relatively small, it supports the broader movement toward skills-based hiring. Employers are increasingly able to evaluate candidates based on what they can do rather than using a university degree as an automatic requirement.
29. LinkedIn InMail has a 10% to 25% reply rate
LinkedIn puts InMail reply rates between 10% and 25%, approximately 300% higher than cold emails containing identical content.
That makes InMail a potentially valuable LinkedIn recruiting tool when recruiters need to reach candidates who aren’t actively applying for jobs.
The benchmark shouldn’t be treated as a guarantee, though. Relevant roles, appropriate targeting, personalization, and a clear reason for reaching out can all affect whether candidates respond.
How to use statistics and analytics for LinkedIn success
LinkedIn statistics give you the big picture, while your own analytics show what’s happening on your company page. The most useful strategy comes from combining both rather than treating industry benchmarks as instructions.
1. Compare LinkedIn performance to your other platforms
Start by identifying what LinkedIn contributes compared with the other social media platforms you manage.
LinkedIn may not generate the same reach or engagement as a consumer-focused social network, but those numbers don’t tell the whole story. For a B2B company, a smaller LinkedIn audience made up of relevant professional buyers can be more valuable than a much larger audience elsewhere.
Compare metrics such as follower growth, impressions, engagement, clicks, web traffic, leads, and conversions over the same date range. Then connect those results to your goals.
For example, Instagram might generate more engagement while LinkedIn delivers fewer clicks but more qualified leads. In that case, judging the two platforms by engagement alone would underestimate LinkedIn’s contribution.
2. Invest more in the LinkedIn content formats that perform best
Platform-wide LinkedIn statistics can show you which formats tend to perform well, but your own data should determine what you create more often.
Separate your LinkedIn posts by format and compare text posts, image posts, video posts, documents, polls, link posts, and other formats you regularly publish. Depending on your goal, look at impressions, engagement rate, comments, reposts, clicks, video views, and conversions.
Go deeper than format, too. If your video content performs well, determine whether that success comes from interviews, product demonstrations, employee content, educational videos, or another topic. If image posts perform best, look for similarities in their subject matter and creative style.
Don’t restructure your content marketing strategy because one post went viral. Look for patterns across several posts. Consistent performance is a much stronger signal that a format or topic deserves more resources.
3. Use LinkedIn demographics to reach the right professionals
LinkedIn demographics tell you who could see your content. Your analytics help you determine whether you’re actually attracting the professionals your business wants to reach.
For LinkedIn, basic demographics only go so far. Age, gender distribution, and location can provide context, but professional characteristics such as job title, seniority, industry, and company size can be much more valuable for B2B marketers.
Compare LinkedIn’s broader user base with your own audience. If you’re trying to reach professional buyers at enterprise companies but most of your engagement comes from young professionals or job seekers, for example, you may need to adjust your topics, positioning, or distribution.
The goal isn’t simply to attract more LinkedIn members. It’s to build an audience that’s relevant to what your business wants to achieve.
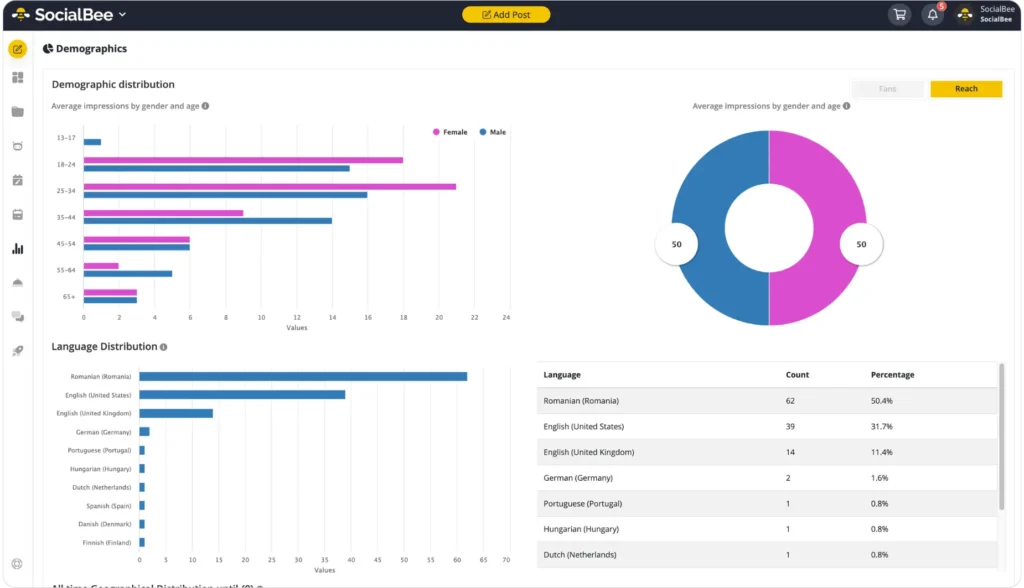
Platform-wide LinkedIn demographics can help you estimate the audience available to you, but your account data provides the context you need to refine your strategy. SocialBee‘s demographics help you review audience insights, making it easier to see who you’re reaching. Use those findings to adjust your content around the professionals you actually want to attract.
4. Benchmark your LinkedIn results against relevant averages
Benchmarks help you put your LinkedIn performance into context. An engagement rate or follower growth percentage means more when you know how it compares with similar accounts.
Whenever possible, narrow your comparison by industry, company page size, and content format. A small B2B company shouldn’t expect the same results as a global brand with millions of LinkedIn members.
The same principle applies to LinkedIn campaigns. LinkedIn advertising statistics such as average click-through rates and cost per lead can help you understand the wider market, but they aren’t universal targets. A higher LinkedIn ads cost may still be worthwhile if those ads deliver high-quality leads with strong conversion potential.
Use benchmarks to spot results that deserve investigation. If you’re significantly outperforming an average, determine what’s working. If you’re falling behind, compare your content, audience, posting frequency, and campaign setup before assuming the platform itself is the problem.
5. Track LinkedIn performance consistently over time
One successful post doesn’t prove your LinkedIn strategy works, just as one poor post doesn’t mean it needs to be rebuilt.
Choose a consistent reporting cadence and monitor the metrics connected to your goals. For most businesses, a monthly review provides enough data to identify patterns without overreacting to short-term fluctuations.
Depending on your strategy, your LinkedIn reports might track:
- Follower growth
- Impressions
- Engagement rate
- Reactions, comments, and reposts
- Link clicks and web traffic
- Top-performing LinkedIn posts
- Video performance
- Leads and conversions
- Paid campaign performance
Add context to those numbers. Note when you changed your posting frequency, launched LinkedIn campaigns, experimented with video uploads, introduced a new content series, or published a particularly successful post. Otherwise, six months of data can show you what changed without telling you why.
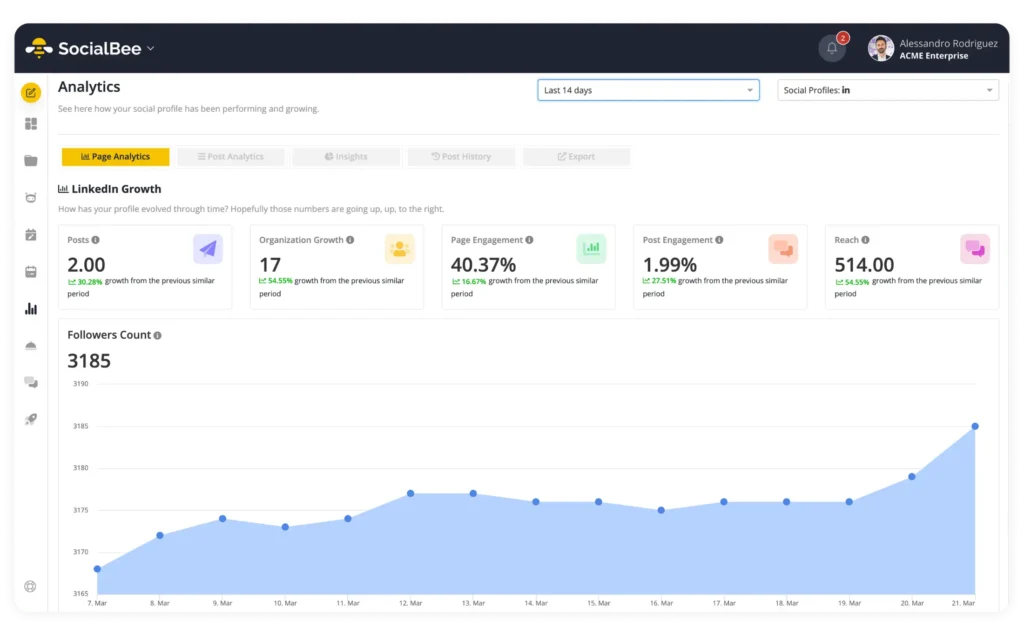
SocialBee‘s LinkedIn analytics let you track post performance and engagement without relying on isolated snapshots. You can review results alongside your other social media accounts and create PDF reports to share with clients, your team, or stakeholders. That makes recurring reporting more useful because you can compare periods, identify patterns, and turn the findings into specific changes for your next month of content.
Frequently asked questions
1. Where can I see LinkedIn statistics?
For your own account, you can access LinkedIn analytics from your company page or personal LinkedIn profile, depending on the statistics you want to review. Company page analytics include data on content, visitors, followers, search appearances, leads, competitors, and more.
For a broader view, tools like SocialBee can help you analyze LinkedIn performance alongside your other social media platforms from a single dashboard.
2. How many people use LinkedIn in 2026?
LinkedIn has more than 1.3 billion members worldwide. The platform also has more than 144,000 schools listed and is used by approximately 100% of Fortune 500 companies.
It’s important to distinguish LinkedIn members from monthly active users. The 1.3 billion figure refers to the platform’s total member base rather than the number of people who log in and actively use LinkedIn each month.
3. What age group uses LinkedIn the most?
People aged 25 to 34 are LinkedIn’s largest age group, accounting for 33.4% of users worldwide as of October 2025.
Young professionals aged 18 to 24 represent another 20.5% of LinkedIn’s user base, while users over 55 account for 1.8%.
4. What is the average LinkedIn engagement rate?
There isn’t one LinkedIn engagement rate that applies equally to every post because performance varies by format. Based on 2025 engagement-by-impressions benchmarks, native documents lead with a 7% average engagement rate, followed by multi-image posts at 6.45% and video posts at 6%.
Image posts average 5.3%, text posts 4.5%, polls 4.2%, and link posts 3.25%. Compare these benchmarks with posts of the same format rather than using a single platform-wide average.
5. What type of content performs best on LinkedIn?
Native document posts currently record the highest average engagement rate by impressions on LinkedIn, at 7%. Multi-image posts follow at 6.45%, while video posts average 6%.
That doesn’t mean every company should prioritize documents. Images typically generate a 2x higher comment rate, while video views increased 36% over the past year. Choose formats based on the outcome you want, then use your own LinkedIn data to determine what performs best with your audience.
Improve your LinkedIn strategy based on real numbers
LinkedIn’s scale matters, but the more useful statistics are the ones that tell you how people behave once they’re there. More than 1.3 billion members have joined the professional network, video consumption is growing, consistent posting is associated with stronger engagement, and LinkedIn remains a key channel for B2B lead generation, advertising, and recruiting.
Use these LinkedIn statistics to set expectations and identify opportunities, but don’t build your strategy around industry averages alone. Compare the benchmarks with your own audience growth, engagement, content formats, clicks, and leads to understand where your company page is actually gaining ground.
SocialBee can help you bring that data together by tracking LinkedIn content and account performance alongside your other social media channels. Instead of reviewing each platform separately, you can use one dashboard to identify your strongest posts, monitor changes over time, and export PDF reports when you need to share results with clients or stakeholders.
Start your 14-day free SocialBee trial and use your LinkedIn analytics to make more informed content decisions.