
Facebook statistics show that the platform still operates at a scale few social networks can match. With billions of monthly active users, Facebook continues to give businesses access to a broad audience across age groups, markets, and content formats.
But Facebook usage has changed. People can move between Reels, videos, Facebook Groups, Facebook Marketplace, Stories, Messenger, and the traditional feed, while businesses compete for attention through both organic content and Facebook advertising. Looking only at Facebook’s user base doesn’t tell you which of those opportunities deserves your time.
In this guide, we’ll look at the latest Facebook stats on users, demographics, engagement, Reels, Stories, Messenger, businesses, ads, and influencer marketing. Then, we’ll turn those numbers into practical decisions you can apply to your own social media strategy.

We’re SocialBee LABS SRL, part of WebPros. We use the information you provide to share relevant content & updates, as outlined in our Privacy Policy. You can opt out anytime.
Short summary
- Facebook has 3.07 billion monthly active users and 2.11 billion daily active users, with men aged 25 to 34 making up its largest demographic group.
- The average Facebook engagement rate is 0.15%, while Facebook Reels lead content formats with an average engagement rate of 0.25%.
- Facebook remains a major publishing channel for brands, accounting for 44.5% of the 9.3 million social media posts analyzed by SocialBee in 2025.
- Facebook also represented 31% of growing social profiles in SocialBee’s analysis, the largest share of any platform studied.
- Facebook Stories reach 2.05 billion users daily, while short Reels designed to loop can generate 23.6% more reach.
- Facebook Messenger has approximately 942 million users worldwide, with people aged 25 to 34 representing its largest age group in the US.
- Facebook plays a major role in social commerce, with 51.2% of social shoppers saying their most recent social purchase happened on Facebook Marketplace.
- Facebook ads reached 2.28 billion users in January 2025, while Meta generated $196.18 billion in advertising revenue during 2025.
Facebook user demographics
Facebook’s audience remains enormous and spans multiple generations, although adults aged 25 to 34 make up its largest demographic group. The platform also has a noticeably larger male audience across most age groups.
1. Facebook has 3.07 billion monthly active users
Facebook has 3.07 billion monthly active users worldwide, giving it one of the largest audiences of any social media platform.
At this scale, Facebook reaches a substantial share of global internet users. For businesses, that means the platform can support a wide range of target audiences rather than being relevant to only one generation or type of customer.
2. Facebook has 2.11 billion daily active users
Facebook has 2.11 billion daily active users, equivalent to 68.72% of Facebook monthly active users.
In other words, more than two-thirds of Facebook’s monthly users access the platform on a typical day. That frequency matters for marketers because it creates repeated opportunities to reach the same audience through feed posts, Facebook Stories, Reels, Groups, and other parts of the platform.
3. Men aged 25 to 34 are Facebook’s largest demographic group
Men between 25 and 34 represented 18.9% of Facebook’s global audience as of October 2025, making them the platform’s largest demographic group.
Facebook also skews male across most age groups. Male users outnumber female users in every age bracket except those aged 65 and older.
These Facebook demographic statistics are useful for understanding the platform’s audience as a whole, but they shouldn’t replace your own page data. Check the age and gender distribution of your followers before deciding which audiences your Facebook content should prioritize.
Facebook usage statistics
Facebook usage remains substantial not only among individual users but also among brands. People use the platform for everything from news and creator content to entertainment, while SocialBee’s own data shows that Facebook continues to dominate day-to-day brand publishing and audience growth.
4. The average Facebook visit lasts 10 minutes and 12 seconds
The average user spends approximately 10 minutes and 12 seconds on Facebook per visit.
Users access Facebook for enough time to encounter several types of content within a single session, whether they’re scrolling through their feed, watching Facebook videos and Reels, checking Groups, or visiting business pages.
For brands, the challenge is earning a place within that limited window. Strong opening lines, immediately understandable visuals, and video hooks that get to the point quickly can help content compete for attention in a person’s Facebook feed.
5. More than 40% of Facebook users pay attention to mainstream news on the platform
More than 40% of Facebook users said they pay attention to news from mainstream news outlets and journalists on the social network, according to a global survey conducted in February 2025.
Creators also play a notable role in what users consume. Another 25% of Facebook users access the platform to pay attention to personalities and creators.
These figures show that Facebook usage extends beyond keeping up with friends and family. Publishers, creators, public figures, and businesses all compete within the same content environment, which gives brands more context for the types of posts their audience encounters alongside their own.
6. India has more than 403 million Facebook users
India had the largest Facebook user base worldwide as of October 2025, with more than 403 million users.
The United States, Indonesia, and Brazil also each had Facebook audiences exceeding 100 million users.
For international brands, these differences matter. Facebook’s global audience isn’t distributed evenly, so worldwide usage statistics should be paired with country-specific data when deciding where Facebook belongs in a regional digital marketing strategy.
7. Facebook accounts for 44.5% of brand publishing activity in SocialBee’s data
Facebook accounted for 44.5% of the 9,332,840 social media posts analyzed by SocialBee from 2025. In total, SocialBee users published 4,157,751 Facebook posts during the year.
That means almost one in every two posts in the dataset was published on Facebook. No other social media platform came close, making Facebook the most active network for day-to-day brand publishing among the accounts analyzed.
The finding is particularly useful because it reflects actual publishing behavior rather than marketers simply saying they use Facebook. Despite the growing number of social networks competing for attention, brands in SocialBee’s dataset still dedicated a significant share of their publishing activity to Facebook.
8. Facebook represents 31% of growing social profiles
Facebook accounted for 31% of all social profiles that experienced measurable audience growth in SocialBee’s analysis of 11,909 users managing multiple accounts. It was the largest share of any social network included in the research.
Facebook, Instagram, X, and LinkedIn together accounted for more than 96% of observed audience growth, showing how heavily growth remained concentrated among established social networks.
For brands questioning whether Facebook continues to offer opportunities for audience growth, this provides a useful counterpoint to assumptions that the platform has stopped growing. Facebook’s enormous existing user base doesn’t prevent individual business accounts from continuing to gain followers.
Facebook engagement statistics
Facebook engagement remains relatively low compared with some other social networks, with an average engagement rate of 0.15%. However, performance varies considerably by post type, page size, and industry, so the overall average only tells part of the story.
9. Facebook’s average engagement rate is 0.15%
The average Facebook engagement rate is 0.15%, remaining flat year over year.
For brands, the lack of movement is useful context when evaluating their own results. If your engagement has remained relatively stable, that doesn’t necessarily indicate that your content strategy has stalled, especially when the platform-wide benchmark hasn’t increased either.
Use 0.15% as a reference point rather than a universal target. Page size, industry, and the types of posts you publish can all influence how often Facebook users engage with your content.
10. Status posts have an average engagement rate of 0.20%
Status posts reached an average Facebook engagement rate of 0.20% in 2025, up from 0.15% in 2024.
The improvement is notable because status posts don’t rely on photos or Facebook videos to attract engagement. A straightforward text update can make it easy for users to react or join a conversation without clicking through to another piece of content.
Status posts become particularly effective as audiences grow. For pages with more than 10,000 followers, they consistently generate more likes than other formats.
The takeaway isn’t to replace visual content with text. Instead, test conversational status posts alongside images, albums, Reels, and links, especially when you have a question or topic that can generate discussion without needing a visual.
11. Albums generate the most likes for Facebook pages with fewer than 10,000 followers
For Facebook pages with fewer than 10,000 followers, albums generate more likes than other post types on average.
Packaging several images into one post gives users more content to browse and react to, which may help albums hold attention better than a single image for smaller communities.
The pattern changes after a page reaches 10,000 followers. At that point, status posts begin generating the most likes, showing why page size should be considered when comparing content performance.
Rather than following a single Facebook-wide recommendation, compare formats within your own follower range. What works for a business page with 3,000 followers may not be the best approach for one with 300,000.
12. Status posts generate the most comments for Facebook pages with more than 5,000 followers
Status posts lead other Facebook formats for average comments once pages exceed 5,000 followers.
Pages with 5,000 to 10,000 followers average five comments on status posts, compared with one for albums, Reels, images, and link posts. The difference continues as pages grow. Pages with 50,000 to 100,000 followers average 13 comments on status posts, compared with seven for images and five for both albums and Reels.
For pages with 100,000 to 1 million followers, status posts average 17 comments, while images average 12, albums and Reels average 10, and links average six.
This makes status posts particularly interesting when conversation is the goal. A clear question, opinion, or timely topic can give users an easy opening to respond without asking them to watch a video or leave the person’s Facebook feed.
13. Sports pages have an average Facebook engagement rate of 0.23%
Sports teams recorded the highest average Facebook engagement rate among the selected industries in 2024, at 0.23%.
Higher Education followed at 0.13%, while influencers averaged 0.10%. Fashion, Health and Beauty, and Home Decor were among the industries with the lowest engagement rates.
These differences show why industry benchmarks can be more useful than comparing your page with Facebook’s overall 0.15% average engagement rate. A result that’s weak for one industry may be perfectly normal for another.
When benchmarking Facebook engagement, narrow the comparison as much as possible by industry, page size, and content type before deciding whether your performance needs improvement.
14. Facebook Reels have an average engagement rate of 0.25%
As of October 2025, Facebook Reels generated an average engagement rate of 0.25% relative to page followers, making them the most engaging post type in this dataset.
At the other end of the spectrum, link posts recorded the lowest average engagement rate at 0.10%.
These Facebook engagement statistics point to an important distinction between formats. Status posts can perform particularly well for likes and comments, especially on larger pages, while Reels lead when engagement is measured relative to follower count.
For social media marketers, there’s little reason to choose one format exclusively. Use Facebook Reels when video suits the idea and you want a more engaging format, while status posts can support conversations that don’t require the additional production involved in video.
Facebook Story statistics
Facebook Stories remain a major part of the platform, with billions of daily users and signs that consumers plan to use the format even more.
15. Facebook Stories reach 2.05 billion users every day
Facebook Stories reach 2.05 billion users daily, giving the format an enormous potential audience for brands and creators.
Stories occupy a different role from permanent feed posts because they’re designed for quick, temporary updates. Businesses can use them for timely announcements, behind-the-scenes content, offers, polls, and other posts that don’t necessarily need a permanent place on the page.
For marketers deciding whether Facebook Stories still deserve space in their content calendar, their daily reach suggests the format remains far from niche.
16. More than 500 million people use each of Meta’s Stories experiences daily
More than half a billion people use each of Meta’s Stories experiences every day, including Stories across Facebook and Messenger, Instagram, and WhatsApp.
That scale shows how familiar the vertical, temporary content format has become across Meta Platforms. Users don’t encounter Stories on just one social media platform, which can make the format particularly useful for businesses already creating similar content across several Meta apps.
17. 62% of US consumers plan to use Stories more in the future
62% of people surveyed in the US said they planned to use Stories more in the future than they did at the time of the research done by Meta.
For brands, growing consumer interest gives Stories a role beyond simply filling the gaps between feed posts. The format can provide additional touchpoints with an audience throughout the day, especially for content that benefits from immediacy rather than long-term visibility.
Facebook Reels statistics
Facebook Reels operate at enormous scale, but the first few seconds can determine whether someone keeps watching. The latest Facebook video statistics also show that speech and looping can influence retention, reach, and engagement.
18. 61% of consumers say Reels ads increased their consideration of a brand
61% of people surveyed by Meta said Reels ads led them to further consider a brand, product, or service they were already aware of.
This suggests Reels can play an important role after initial brand awareness, giving Facebook advertisers another opportunity to keep products in consideration through short-form video.
For brands creating Facebook video ads, that makes Reels particularly relevant for retargeting or campaigns aimed at audiences who already have some familiarity with the business.
19. People share 3.5 billion Reels every day
People share 3.5 billion Reels every day across Facebook and Instagram, according to Meta.
Sharing is particularly valuable because it moves a Reel beyond its original viewer and puts it in front of additional people through direct recommendations and conversations.
For social media marketers, shares are therefore worth tracking alongside views and likes. If certain Facebook Reels consistently get sent to other users, look at the topics, hooks, or creative approaches behind them and use those insights when planning future videos.
20. Starting Facebook Reels with speech can increase 10-second retention by 24.7%
Facebook Reels where human speech starts within the first three seconds record 24.7% higher retention at the 10-second mark than music-only videos.
The advantage also appears earlier and later in the video. Reels with speech record 11.7% higher three-second retention and 6.6% higher 30-second retention.
Speech also makes viewers more likely to listen with sound on. The ratio of sound-on three-second views is 8.8% higher when a Reel features human speech.
For brands creating Facebook videos, the practical lesson is simple: don’t automatically rely on music and visuals to provide the hook. When speech makes sense for the content, introducing a person, question, statement, or explanation immediately can give viewers more reason to stay.
21. Looping short Facebook Reels can increase reach by 23.6%
Facebook Reels lasting up to seven seconds achieve 23.6% higher reach when they’re designed to loop.
Loops also produce an 18.7% higher replay rate and a 16.1% higher engagement rate for these micro-length videos.
The effect becomes weaker as video length increases, so looping shouldn’t become the default approach for every Reel. It’s most useful when the concept can be understood almost instantly and the transition from the end back to the beginning feels natural.
For example, a quick visual transformation, product detail, reaction, or short demonstration may lend itself to repeat viewing better than a longer educational Facebook video.
Facebook Messenger statistics
Facebook Messenger remains one of the world’s largest messaging services, with hundreds of millions of users and particularly high penetration in several markets.
22. Facebook Messenger has 942 million users worldwide
Facebook Messenger had approximately 942 million users worldwide as of October 2025.
That audience gives Messenger a significant place within Facebook’s wider ecosystem. For businesses, Messenger also provides a direct communication channel separate from interactions happening publicly beneath posts.
The size of its user base is particularly relevant for brands using Facebook for customer communication, where users may move from seeing content or an ad to starting a private conversation with the business.
23. Facebook Messenger has 206.1 million users in the United States
Facebook Messenger reached 206.1 million users in the United States as of June 2026.
Women represented 54.1% of the US Messenger audience, while people aged 25 to 34 made up its largest age group.
These demographics make Messenger relevant to a broad US audience, but businesses should still consider whether their own customers use messaging as a preferred way to ask questions, request support, or interact with brands.
24. Facebook Messenger is the most-used messaging brand among US consumers
Facebook Messenger ranked as the most-used messenger brand among US consumers in a 2025 Statista survey.
The research surveyed 15,502 consumers in the United States, with Facebook Messenger taking the top position and Viber ranking at the opposite end.
For businesses already using Facebook, that familiarity can reduce friction when customers want to move from browsing a business page or post to having a direct conversation.
25. Facebook Messenger reaches 83.3% of internet users in the Philippines
The Philippines had the highest Facebook Messenger reach as of October 2025, with 83.3% of internet users using the service.
Vietnam followed closely, with Messenger reaching 78.1% of internet users.
These regional differences matter for international businesses. Messenger may be a secondary communication channel in one country but a major part of how people communicate online in another, so market-specific usage statistics should inform whether businesses prioritize it for customer conversations.
Facebook business statistics
Facebook remains an important commercial platform, particularly for social commerce. Facebook Marketplace gives users a built-in place to discover and purchase products, while marketers continue to rank Facebook among their most important social media channels.
26. 51.2% of recent social purchases happen on Facebook Marketplace
51.2% of consumers who shop through social media say their most recent social purchase happened on Facebook Marketplace, giving it the largest share of social commerce.
Facebook Marketplace benefits from being integrated into a platform people already use for browsing, communicating, and discovering products. For businesses selling suitable products, that makes Marketplace another potential route to customers alongside business pages, organic content, and Facebook advertising.
27. 40% of Facebook users regularly shop on the platform
40% of Facebook users regularly shop on the platform, showing that product discovery and purchasing are established parts of Facebook usage.
For businesses, this means Facebook content doesn’t have to generate an immediate sale to contribute to commerce. Posts, Facebook Reels, ads, Groups, and Marketplace listings can introduce products and keep brands visible before someone is ready to buy.
28. 36% of marketers say Facebook is their most important social media platform
36% of marketers worldwide named Facebook their most important social media platform in a 2026 survey.
The figure is particularly notable given how many leading social media platforms now compete for marketing budgets. Facebook continues to combine a large audience with organic content, Groups, Marketplace, Messenger, Reels, and paid advertising within the same ecosystem.
For social media marketers, however, platform-wide popularity shouldn’t determine investment on its own. Compare Facebook with your other channels using your own reach, engagement, traffic, leads, and conversions to see where it delivers the most value.
Facebook advertising statistics
Facebook advertising continues to offer enormous reach, with Meta reporting growth in the number of users advertisers can target. Advertising also remains the main revenue engine behind Meta Platforms.
29. Facebook ads can reach 2.28 billion users
Data from Meta’s advertising tools showed that Facebook ads could reach 2.28 billion users in January 2025.
That potential advertising audience increased by 93.3 million users, or 4.3%, between January 2024 and January 2025.
For Facebook advertisers, growing reach means there are still opportunities to find new audiences at scale. However, potential reach isn’t the same as campaign performance. Targeting, creative quality, placement, and campaign objectives ultimately determine whether those ad impressions produce meaningful results.
30. Brand awareness accounts for more than 37% of Facebook ad campaign impressions
Brand awareness was the leading Facebook campaign type, accounting for more than 37% of 30.32 million analyzed ad impressions. Traffic campaigns followed at 24.6%.
The difference shows that Facebook ads are frequently used higher in the marketing funnel rather than exclusively to generate immediate conversions.
When analyzing your own Facebook ad statistics, compare results with the objective you selected. Metrics such as reach and ad impressions may be useful for awareness campaigns, while click-through rate, cost per click, and average conversion rate become more important when the goal is to drive action.
31. Meta generated $196.18 billion in advertising revenue in 2025
Meta Platforms generated $196.18 billion in advertising revenue during 2025, with Q4 alone contributing $58.23 billion.
Fourth-quarter average revenue from ads increased 21% year over year, demonstrating the continued scale of Meta’s advertising business across Facebook and its other platforms.
It’s important not to describe the $196.18 billion as Facebook revenue alone, since the figure covers Meta’s advertising business more broadly. Still, Facebook remains part of an advertising ecosystem that spans feed ads, Reels and other video ads, Stories, and placements across mobile devices.
Facebook influencer marketing statistics
Facebook may not be the first platform associated with influencer marketing, but creators still have a substantial presence there. Brands use the platform for influencer campaigns, particularly when community building and traffic are priorities.
32. 28.4% of users prefer Facebook for influencer campaigns
28.4% of users say they prefer Facebook as a platform for influencer campaigns, placing it fourth behind Instagram, TikTok, and YouTube.
Facebook’s position behind more creator-focused platforms doesn’t make it irrelevant to influencer marketing. Its established user base, Facebook Groups, Reels, and sharing features can still make it valuable when a creator’s audience is already active there.
Instead of choosing influencers based solely on which social network is most popular for creator content, brands should consider where that particular creator’s community is most engaged.
33. Facebook paid creators nearly $3 billion in 2025
Facebook paid content creators nearly $3 billion in 2025, a 35% increase from the previous year and the platform’s highest annual total to date.
The increase shows Facebook is continuing to invest in its creator ecosystem as it competes for video creators and audiences across social media.
For brands, a larger and more active creator ecosystem can also mean more options when searching for partners, from established influencers to niche creators with smaller but highly engaged communities.
34. Facebook influencer collaborations generate 20 clicks per 1,000 impressions
Facebook influencer collaborations generate an average of 20 clicks per 1,000 impressions.
This is a useful reminder that influencer marketing performance shouldn’t be measured through likes and comments alone. When the goal is to generate traffic, clicks can reveal whether viewers are interested enough to move beyond the creator’s content and take the next step.
Brands should define that goal before launching a collaboration and give creators trackable links or other attribution methods where possible.
35. 47% of brands use Facebook for community-focused influencer campaigns
47% of brands use Facebook for community-focused influencer campaigns.
Facebook Groups, comment sections, Reels, and other community features give influencers several ways to interact with audiences beyond publishing a sponsored post.
That can make Facebook particularly relevant when the objective is ongoing conversation rather than one-time reach. For brands evaluating influencers, audience interaction and community fit may therefore be more useful indicators than follower count alone.
How to use these Facebook statistics alongside analytics in your social media strategy
Facebook statistics provide context for what’s happening across the platform, while your own analytics show how your audience behaves. Use the two together to decide where Facebook fits in your strategy and which changes are actually worth making.
1. Compare Facebook performance to your other platforms
Start by comparing Facebook with the other social media platforms you manage. The goal isn’t to find the network with the biggest number in every column, but to understand what each one contributes.
Facebook might generate more link clicks and conversations for your business, while Instagram produces stronger engagement or another platform drives more audience growth. Compare reach, engagement, follower growth, clicks, and other metrics tied to your goals over the same date range.
Be careful with direct comparisons, though. A Facebook video view and an interaction on another social media platform may be measured differently. Focus on comparable metrics and, where possible, connect them to outcomes such as website visits, leads, or sales.
2. Invest more in the formats that drive engagement
Don’t decide your content mix based solely on what Facebook appears to be prioritizing. Use platform-wide Facebook engagement statistics to identify formats worth testing, then let your own results determine what you publish more often.
Separate photo posts, video posts, link posts, status posts, Facebook Reels, and other formats when analyzing performance. Look beyond the average engagement rate and compare reach, reactions, comments, shares, clicks, and views.
For example, if Facebook Reels are generating more reach but photo posts consistently produce more comments and shares, both formats may deserve a place in your strategy for different reasons.
I recommend looking for patterns across several posts rather than changing direction because one Reel or image performed unusually well. The more consistent the pattern, the stronger the case for reallocating your content resources.
3. Use Facebook data to keep your content relevant
Facebook demographic statistics can tell you who uses the platform overall. Your account analytics tell you who actually interacts with your business.
Compare Facebook’s global audience with your own follower demographics. Pay attention to factors such as age group, gender, location, and changes in your audience over time. If most Facebook users in your target market differ from the people currently following your page, you may need to reconsider your topics, creative, targeting, or distribution.
Behavior matters too. Look at which posts your Facebook users interact with and what those posts have in common. A business might discover that its audience responds strongly to educational videos but largely ignores promotional link posts, for example.
Use those insights to create content around demonstrated audience interests instead of relying on assumptions about the average Facebook user.
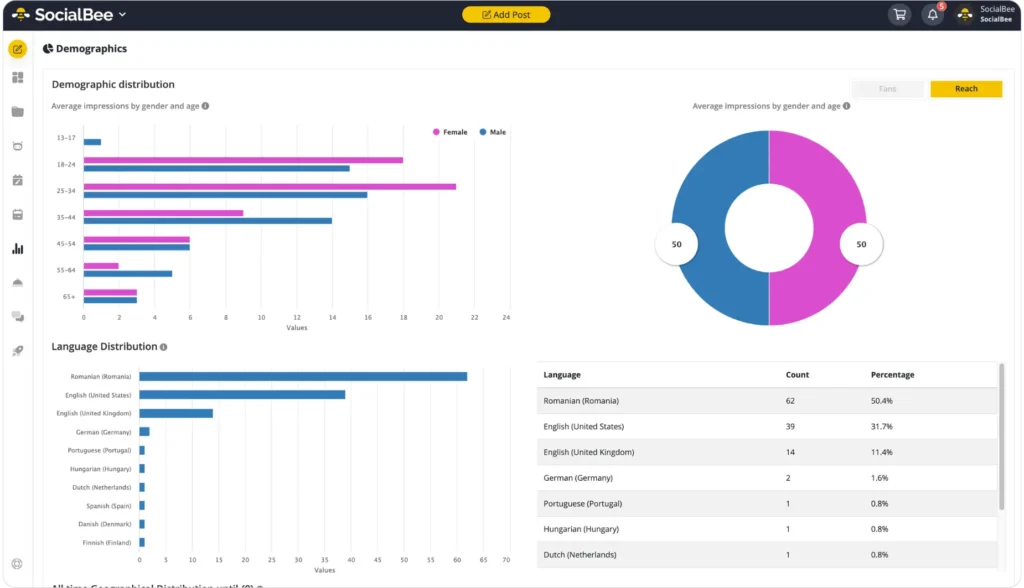
Platform-wide Facebook demographic statistics can show you who could be part of your audience, but your own data tells you who you’re actually reaching.
With SocialBee’s Facebook analytics, you can analyze your audience demographics, including age, gender, and location, alongside page and content performance. Use these insights to check whether your current Facebook audience matches your target customers and adjust your content when the two start to drift apart.
4. Benchmark your results against industry averages
Benchmarks help answer a question that your Facebook analytics can’t answer alone: is this result strong or weak compared with similar accounts?
Compare metrics such as your average engagement rate, click-through rate, reach, views, and paid advertising performance with relevant industry averages. Whenever possible, choose benchmarks based on account size, industry, content format, or campaign type rather than relying on one Facebook-wide average.
The same applies to Facebook ads. Average click-through rates, cost per click, and conversion rates can provide useful context, but they shouldn’t become targets by default. Your own economics matter more. An ad with a higher-than-average cost per click could still be successful if those clicks generate valuable conversions.
Benchmarks are best treated as diagnostic tools. If your results are significantly above or below the average, investigate why before deciding what to change.
5. Monitor changes in performance with consistent reporting
Individual posts tell you what happened once. Consistent social media reporting helps you see whether your Facebook performance is improving, declining, or simply fluctuating.
Choose a regular reporting schedule and keep your core metrics consistent. For most businesses, monthly reporting provides enough data to identify meaningful patterns without reacting to every short-term change.
Depending on your goals, your Facebook report might track:
- Reach and impressions
- Audience growth
- Engagement rate
- Reactions, comments, and shares
- Link clicks
- Reels and video performance
- Top-performing posts
- Paid campaign performance
Add context to the numbers as well. Record major campaigns, changes in posting frequency, unusually successful content, paid promotions, or other events that could explain a shift in performance.
The process should repeat: review the data, identify what changed, determine what likely caused it, adjust your strategy, and measure the results again. That’s how Facebook statistics become useful rather than just interesting numbers.
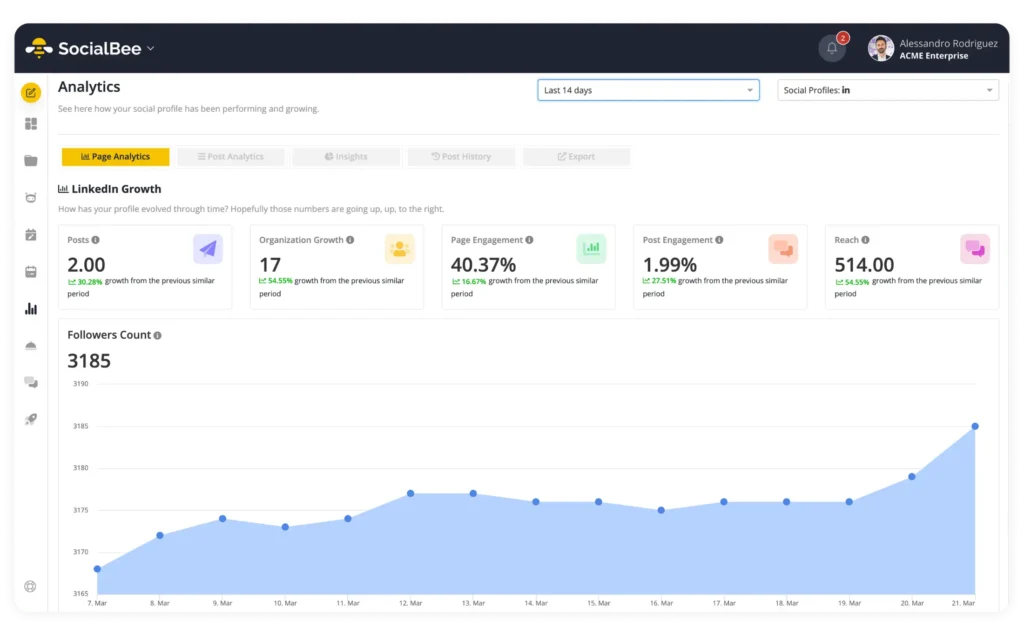
If you’re reporting on Facebook regularly, SocialBee can reduce the manual work involved in collecting and presenting your data. Its analytics dashboard lets you track page growth, reach, engagement, and individual post performance over time, so you can spot changes without piecing together numbers from separate reports. You can also export your analytics as a PDF, which is useful for sharing recurring performance reports with clients, your team, or other stakeholders.
Frequently asked questions
1. How many Facebook users are there in 2026?
Facebook has 3.07 billion monthly active users worldwide, making it one of the largest social media platforms by audience size. There are 2.11 billion Facebook daily active users, meaning 68.72% of its monthly users access Facebook on a typical day.
2. Which age group uses Facebook the most?
Men aged 25 to 34 make up Facebook’s largest demographic group, accounting for 18.9% of its global audience as of October 2025.
Facebook’s user base also skews male across most age groups. Men outnumber women in every age bracket except among users aged 65 and older.
3. Is Facebook gaining or losing users?
Facebook continues to have a large active audience, and there are signs of growth in both organic audiences and advertising reach. Facebook represented 31% of all growing social profiles in SocialBee’s 2025 analysis, the highest share of any platform included in the research.
Facebook’s advertising audience also grew. The number of users marketers could reach with Facebook ads increased by 93.3 million, or 4.3%, between January 2024 and January 2025.
4. What is the average Facebook engagement rate?
The average Facebook engagement rate is 0.15%, remaining flat year over year.
However, engagement varies considerably depending on page size, industry, and post format. For example, status posts reached an average engagement rate of 0.20% in 2025, while Facebook Reels recorded 0.25% in a separate October 2025 dataset.
Use the overall average as a benchmark, then compare it with similar pages and your own historical Facebook engagement.
5. What type of content performs best on Facebook?
Facebook Reels recorded the highest average engagement rate at 0.25% as of October 2025, while link posts had the lowest at 0.10%.
However, there isn’t one format that performs best for every metric or account. Status posts can be particularly effective for generating likes and comments on larger pages, while albums tend to generate the most likes for pages with fewer than 10,000 followers.
The best approach is to test Reels, status posts, photos, albums, videos, and links, then use your own analytics to identify which formats support your specific goals.
Make Facebook statistics work for your strategy
Facebook statistics show that the platform remains a major part of the social media landscape. Billions of people still use Facebook, brands continue to grow their audiences there, and formats such as Reels, Stories, Groups, Marketplace, and Messenger give businesses multiple ways to reach and interact with customers.
But industry averages can’t tell you exactly what your next Facebook post should look like. Use these Facebook stats to understand the wider trends, then compare them with your own reach, engagement, audience growth, demographics, and content performance to see what actually works for your page.
SocialBee brings your Facebook analytics into one dashboard, where you can track page growth, engagement, reach, and individual post performance over time. You can also compare Facebook with your other social media accounts and export analytics as PDF reports, making it easier to turn recurring reporting into actual decisions about what to post next.
The goal is to understand where your Facebook performance stands, identify what moves it in the right direction, and use that data to build a strategy you can improve over time.
Start your 14-day free SocialBee trial and use your Facebook analytics to make smarter content decisions.